
Shiloh Capital

Thamsanqa Netha & Lulu Mukuwane

SHILOH CAPITAL

African Alternative Investment Management

The Capital Is There

Africa's Decade Ahead

AUGUST 2026

Strictly confidential - prepared for African development finance institutions, multilateral banks and development partners

Dedicated to Nigel Chanakira.

INSPIRED BY

Iyinoluwa Aboyeji
Fola Adeola
Tayo Aderinokun
Aigboje Aig-Imoukhuede
Andrew Alli
Jeremy Awori
Nicholas Brathwaite
Aliko Dangote
Hendrik du Toit
Tony Elumelu
Eche Emole
Rachel Kupara
Tope Lawani
Michiel le Roux

Tshepo Mahloele
Strive Masiyiwa
Mia Mottley
Johannes "Jannie" Mouton
James Mwangi
Sizwe Nxasana
Adebayo Ogunlesi
Jim Ovia
Babatunde Soyoye
David Steward
Sim Tshabalala
Chika Uwazie
Nicholas Vingirai
Herbert Wigwe

However far the stream flows, it never forgets its source.

African proverb

These are among those who came before and built what we now stand on. They have inspired us to walk this path.

THANK YOU TO

Iyinoluwa Aboyeji, Chika Uwazie and Eche Emole, for reminding us to build.
Thank you to many friends, family and colleagues for feedback on earlier drafts.

This paper draws on Shiloh Capital's own experience originating, restructuring and stewarding African assets since 2015, together with public data and research from the African Development Bank, the International Monetary Fund, the World Bank Group, the International Finance Corporation, the U.S. International Development Finance Corporation, British International Investment, Proparco, DEG, Afreximbank, GSMA, AVCA, Convergence Blended Finance, the OECD and the Mo Ibrahim Foundation, among others cited throughout. Every figure carries its source; where reliable public data does not exist, we say so rather than guess at it.

Shiloh Capital · Office 212, Max Office Park, 145 Second Street, Parkmore, Sandton, Johannesburg
Updated August 2026

You can see the future first in a restructuring committee.

Not in a pitch deck, and not in a press release - in the quiet, unglamorous meeting where a development finance institution decides what to do with a loan that has been renegotiated twice, an equity stake it has held four years past its intended exit, or a minority position in a company that is, by any honest measure, doing fine, but no longer fits anybody's strategy. These meetings happen every week, in Abidjan and Nairobi, in Pretoria and Cairo, in the credit committees of institutions whose names rarely make the news. Over the past decade the substance of these meetings has not really changed. What has changed is the size of the pile.

African development finance institutions and their peers - the multilateral banks, the bilateral development finance institutions, the sovereign funds - have spent seventy years doing something almost no commercial investor will do: putting patient capital behind first-of-a-kind power plants, undercapitalised banks, unbuilt railways and farmers nobody else would underwrite. That mandate is the reason electricity reaches villages that a spreadsheet would never justify, and it is precisely why these institutions' balance sheets now carry a distinctive residue - loans restructured into a long twilight of partial performance, equity stakes held because no buyer has emerged, minority positions in good businesses that have simply outlived the strategy that created them. Individually, each position has a reasonable explanation. Collectively, they are a very large amount of capital that is neither compounding as a healthy investment nor available for redeployment into Africa's next decade of development priorities.

Almost nobody outside these institutions has added up what that pile actually is. Fewer still have asked what happens to Africa's investment case if it stays exactly where it is for another decade.

We think both questions have answers, and that the answers are more interesting - and more investable - than most people assume. Not because Africa's difficulties are imaginary; they are not, and we spend a full part of this paper on them. But because the continent that will hold a quarter of the world's people and workers by mid-century is currently financed through instruments that were not built for a continent at this stage of its development, and because the gap between those two facts is where the return sits.

Everyone in development finance is now talking about "mobilising private capital," "blended finance," and "balance-sheet optimisation." Comparatively few have sat with the actual

arithmetic: what Africa's growth curve looks like against the rest of the world over the next twenty-five years; what has already been committed to the continent by patient, risk-tolerant institutions; how much of that committed capital is presently stuck rather than working; and what a permanent, professionally managed owner could do with it that a conventional ten-year fund structurally cannot. Put the four together, and a specific, financeable opportunity comes into focus - one that does not require anyone to bet on Africa's story changing, only on somebody finally being positioned to act on the version of it that is already true.

Let us show you what we see.

Table of Contents

IntroductionYou can see the future first in a restructuring committee. I. Counting Africa's NumbersBy 2050 Africa will hold a quarter of the world's working-age people. Tracing the trendlines in population, growth, mobile capital and infrastructure demand, the scale of the opportunity is not a forecast - it is already underwritten by demography. II. From Trapped Value to Governed EquityDevelopment finance institutions already hold the patient capital Africa needs - tens of billions of dollars of it, much of it immobilised on their own balance sheets. Debt-to-equity conversion, held inside a permanent capital structure, is the engine that turns impaired claims into compounding ownership. III. The ChallengesNone of this is easy, and pretending otherwise would not survive a single credit committee. The exit gap, the governance burden, the case for a platform rather than a fund, and why this decade - not the next one - is the one that matters. IV. The FundA concrete proposal: the African Development Assets Permanent Capital Fund, Shiloh Capital's role as sponsor, manager and development partner, five routes for a founding institution to participate, and the sizing of the opportunity in dollars and years. V. Parting ThoughtsWhat if we're right about the decades ahead - and what happens if nobody acts on it? AppendixData tables, sourcing notes, a risk management framework, glossary and important information.
THE CAPITAL IS THERE · AFRICA'S DECADE AHEAD

I. Counting Africa's Numbers

By 2050, one in four working-age people on Earth will be African.

The opportunity this paper describes does not depend on a forecast changing in Africa's favour - it depends on a trendline that has already been running for two decades.

The demographic fact

Every investment case eventually rests on a demographic case, whether its authors admit it or not. Africa's is the starkest of any region on Earth, and it is not a projection built on optimistic assumptions - it is a working-age population that has already been born.

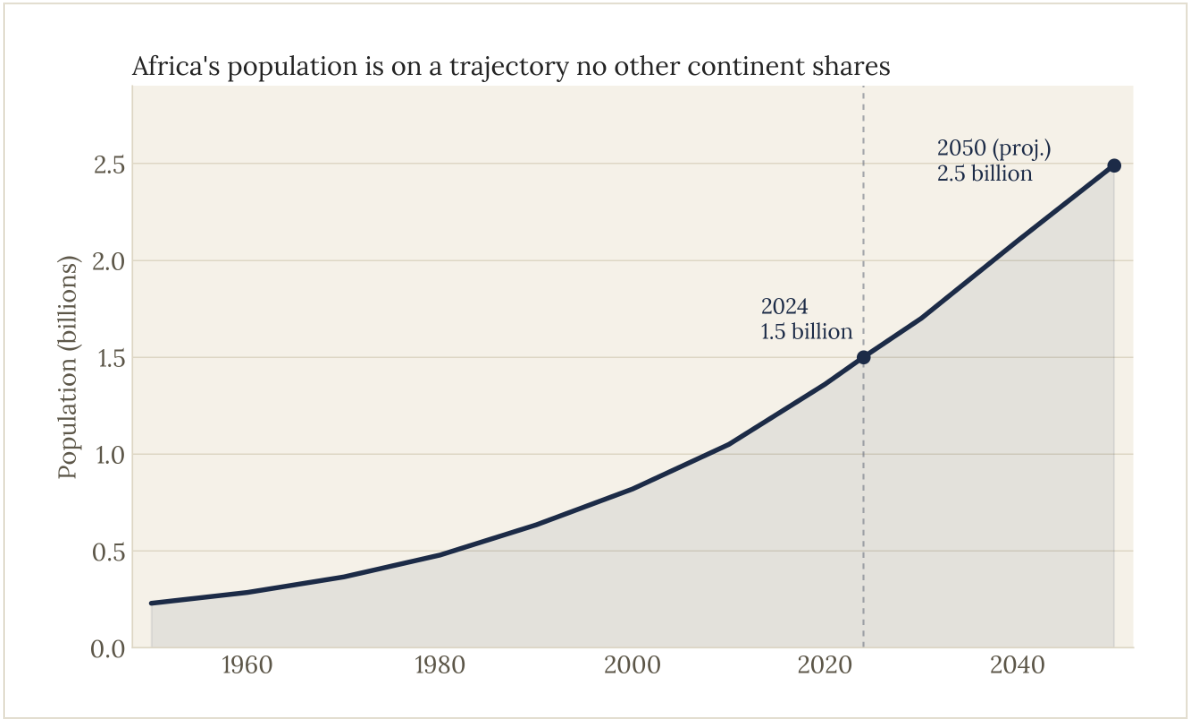
Africa's population passed 1.5 billion in 2024, roughly one in ten people alive.1 The United Nations' own projections have the continent adding a further 950 million people by mid-century - a 63% increase, at a time when several other regions are flat or shrinking - taking Africa's population to roughly 2.5 billion and its share of humanity to close to 28%.2

Figure 1
Figure 1. Africa's population, 1950–2050 (est./proj.). By 2050 the continent is projected to hold close to 28% of the world's people, against roughly 10% today. Source: UN DESA, World Population Prospects 2024; UNECA.

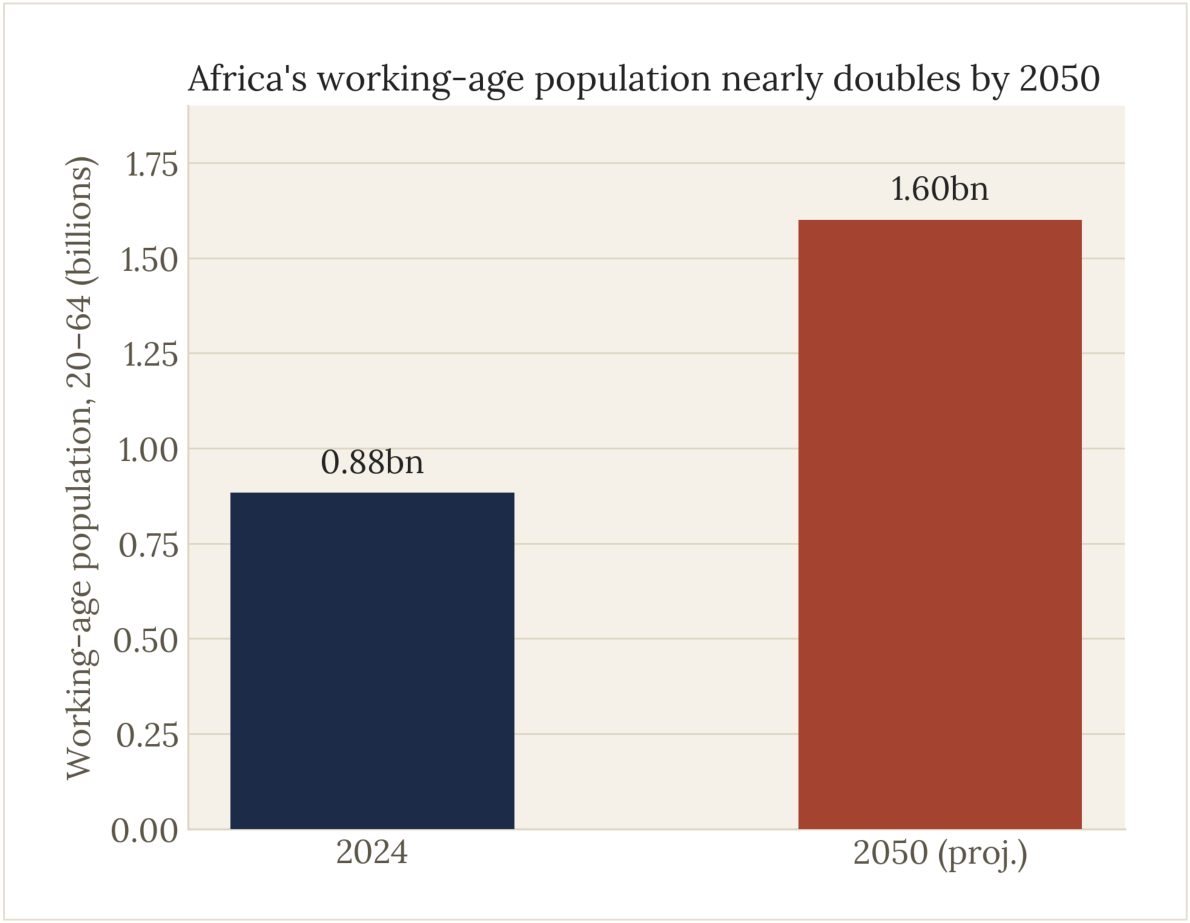
The number that matters more to an investor than the headline population figure is what sits underneath it: the working-age population, 20 to 64 years old, which the UN's Economic Commission for Africa projects will grow from 883 million in 2024 to roughly 1.6 billion by 2050 - around a quarter of the entire world's working-age people.3 The ratio of working-age people to dependents is projected to reach roughly 1.7 to 1 by 2050 - the textbook signature of a demographic dividend opening, of the kind that powered East Asia's growth from the 1960s onward. One in three young people on the planet will be African by 2050.4

Figure 2
Figure 2. Africa's working-age population (20–64), 2024 vs. 2050 (projected). Source: UN DESA / UNECA.

None of this is a reason to be starry-eyed. A demographic dividend is an opportunity, not a guarantee; it has to be financed, employed and educated, and a continent that fails to do so converts a dividend into a liability. We return to that risk directly in Part III. But it is the fixed point against which every other number in this paper should be read: whatever else is true about Africa's difficulties, the market the continent represents in 2050 is not speculative. It is a population that already exists, ageing forward on a clock nobody can slow.

Growing faster than the world it is often compared against

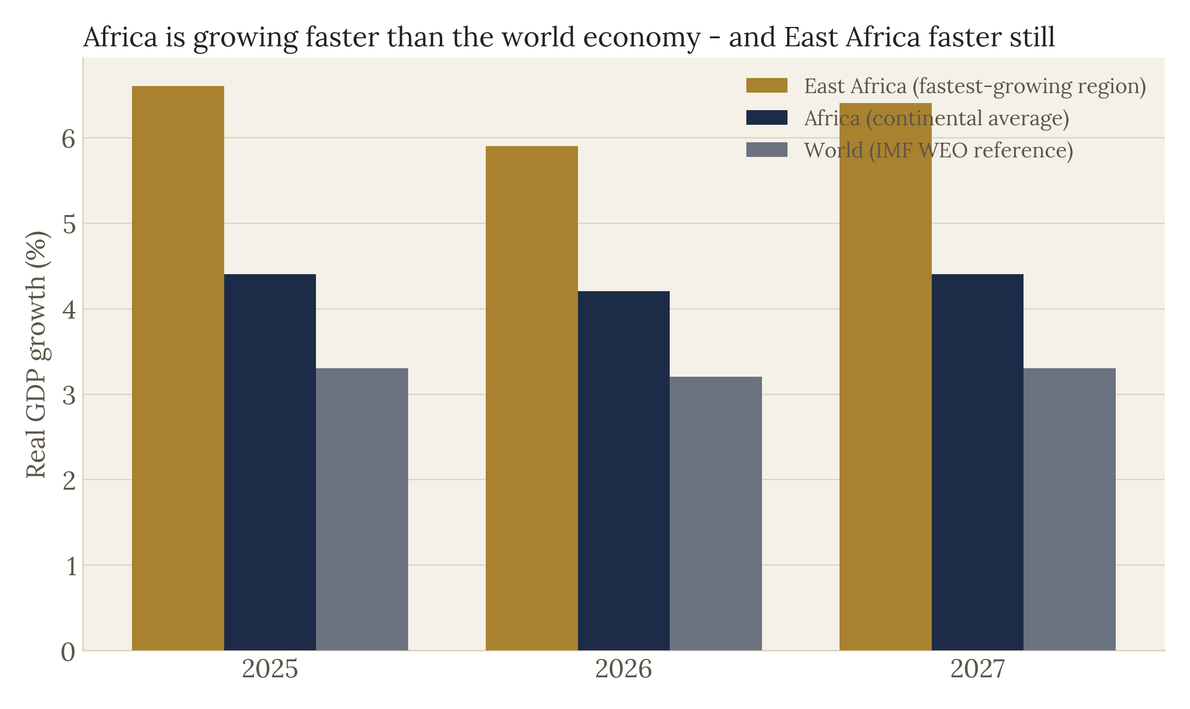
Set against that demography, Africa's recent growth numbers look less like a story about potential and more like a story already in progress. The African Development Bank's African Economic Outlook 2026 puts the continent's real GDP growth at 4.4% in 2025, projected at 4.2% in 2026 and 4.4% in 2027 - with twenty-two countries expected to grow above 5% in 2025 alone.5 East Africa is the standout sub-region, growing at 6.6% in 2025 and a projected 6.4% in 2027.6 The IMF's April

2026 Regional Economic Outlook for Sub-Saharan Africa corroborates the broad picture - 4.5% growth in 2025, easing modestly to 4.3% in 2026 under pressure from global commodity shocks and reduced aid flows - while still placing the region comfortably ahead of the global growth rate.7

Figure 3
Figure 3. Real GDP growth, 2025–2027 (%). Sources: AfDB, African Economic Outlook 2026; IMF, Regional Economic Outlook: Sub-Saharan Africa, April 2026 (World figure is an IMF WEO reference range).

Twelve of the world's twenty fastest-growing economies in 2026 are African, led by Ethiopia (9.2%), Guinea (8.7%), Uganda (7.5%) and Rwanda (7.2%).8 This is not a story confined to resource exporters riding a commodity cycle; it runs through services, agriculture, construction and, increasingly, digitally-enabled commerce. The combined GDP of the fifty-four African Continental Free Trade Area signatories stands at roughly $3.4 trillion.9

A continent that went straight to the phone

If population and growth establish the size of the opportunity, Africa's digital adoption curve shows how quickly the continent absorbs new financial infrastructure once it arrives - a

directly relevant fact for anyone underwriting the ability of African businesses to scale.

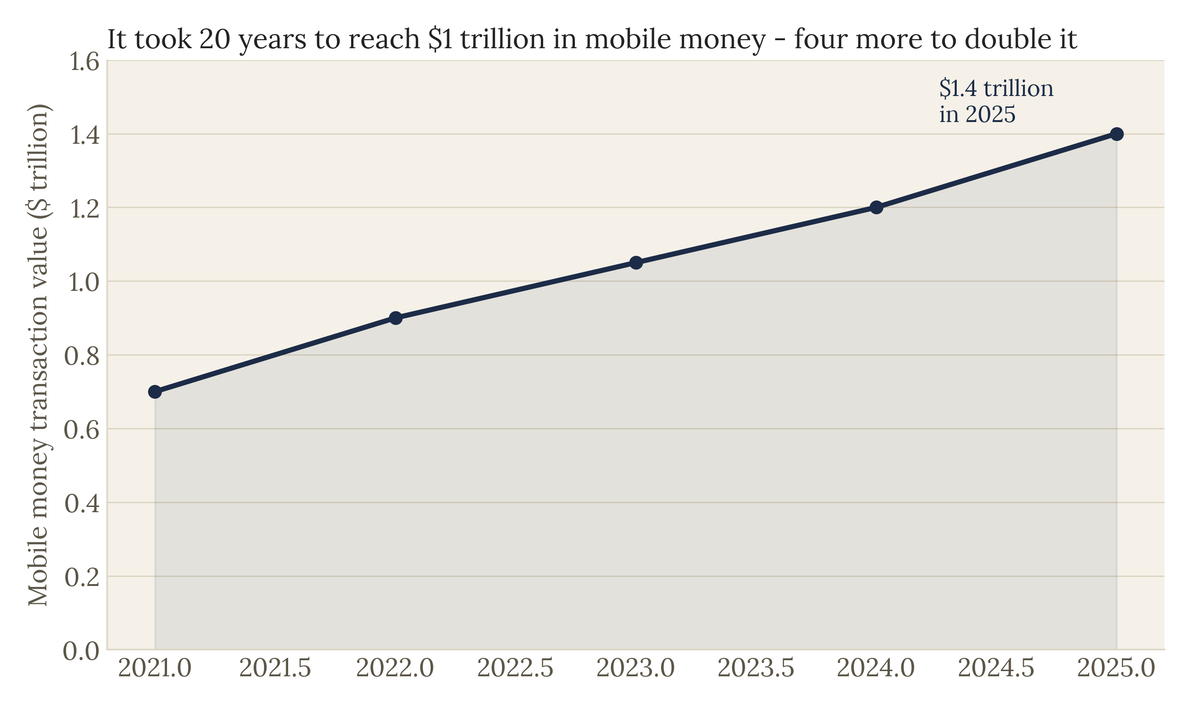
Africa passed one billion registered mobile money accounts by the end of 2024.10 Sub-Saharan Africa alone moved $1.4 trillion through mobile money in 2025 - 66% of the entire world's mobile money transaction value - across 1.2 billion registered accounts.11 The GSMA's own framing of the trend is the most useful summary available: it took twenty years for African mobile money to reach $1 trillion in annual transaction value, and just four more years to double it.12

Figure 4
Figure 4. Mobile money transaction value, Sub-Saharan Africa, 2021–2025 ($ trillion, illustrative trajectory to the disclosed 2025 total). Source: GSMA, State of the Industry Report on Mobile Money 2026.

The pattern repeats in venture and technology financing. African tech startups raised $4.1 billion in equity and debt in 2025, up 25% year-on-year, with fintech taking the largest single share of equity funding.13 The continent's unicorn count reached ten in August 2026, when Nigerian mobility-fintech Moove raised $250 million at a valuation above $2 billion, joining Interswitch, Flutterwave, OPay, Andela, Moniepoint, Wave, Chipper Cash, MNT-Halan and Tyme Group.14 None of these companies exists because Africa waited for fixed-line infrastructure to catch up with the rest

of the world. They exist because the continent skipped that generation of infrastructure entirely and built its financial system on the device already in every pocket.

A market being stitched into one

The African Continental Free Trade Area - the largest free trade area by number of member states in the world - is no longer a policy aspiration. Fifty of fifty-four signatories had ratified the agreement by December 2025, twenty-five had finalised their tariff schedules, and the World Bank's own modelling of the agreement's effects, still the most-cited estimate of its impact, projects it could raise African regional income by $450 billion by 2035, lift intra-African exports by 81%, and move roughly thirty million people out of extreme poverty.15 A fragmented continent of fifty-four separate regulatory jurisdictions is, slowly and unevenly, becoming a single market of 1.3 billion consumers - precisely the kind of structural tailwind that turns a well-run regional business into a continental one.

What Africa still lacks - and who is meant to supply it

None of this happens without financing, and this is where the picture turns from tailwind to constraint. Roughly 600 million people in Sub-Saharan Africa still lack access to electricity - about 80% of the entire world's unelectrified population - and the region is projected to account for 85% of the world's remaining unelectrified people by 2030.16 Africa holds an estimated 60% of the world's best solar resources and attracts roughly 2% of global energy investment.17

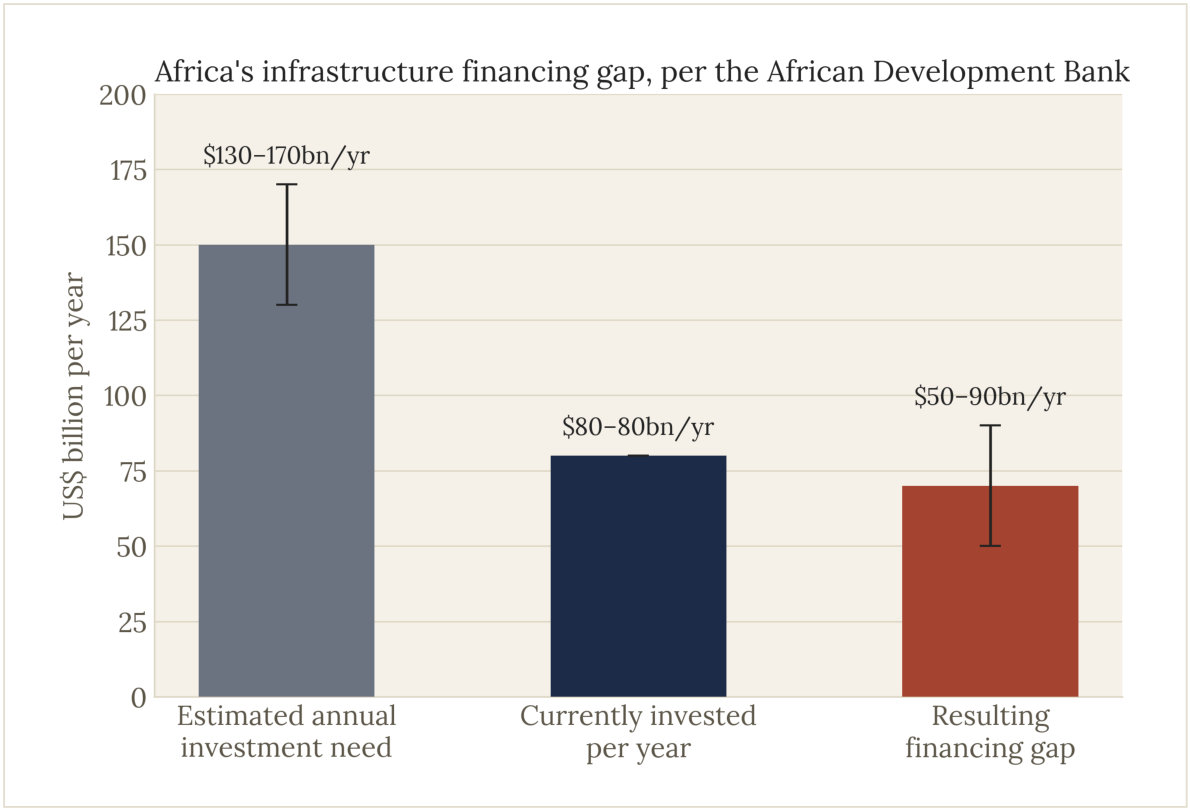
The African Development Bank's current estimate is that the continent needs $130–170 billion a year in infrastructure investment; roughly $80 billion a year is currently invested; the resulting financing gap - the figure informally rounded in industry conversation to "about $100 billion a year" - sits somewhere between $50 and $90 billion annually, a shortfall AfDB itself estimates costs Africa close to two percentage points of GDP growth every year it persists.18 Layer on the AfDB's broader estimate of a $402 billion annual structural-transformation financing gap and a $242 billion annual climate financing gap through 2050, and the total financing need to meet the continent's Sustainable Development Goals exceeds $1.3 trillion.19

Figure 5
Figure 5. Africa's infrastructure financing gap, per the African Development Bank's current cited range. Source: AUDA-NEPAD / Africa-Europe Foundation (2025); AfDB.

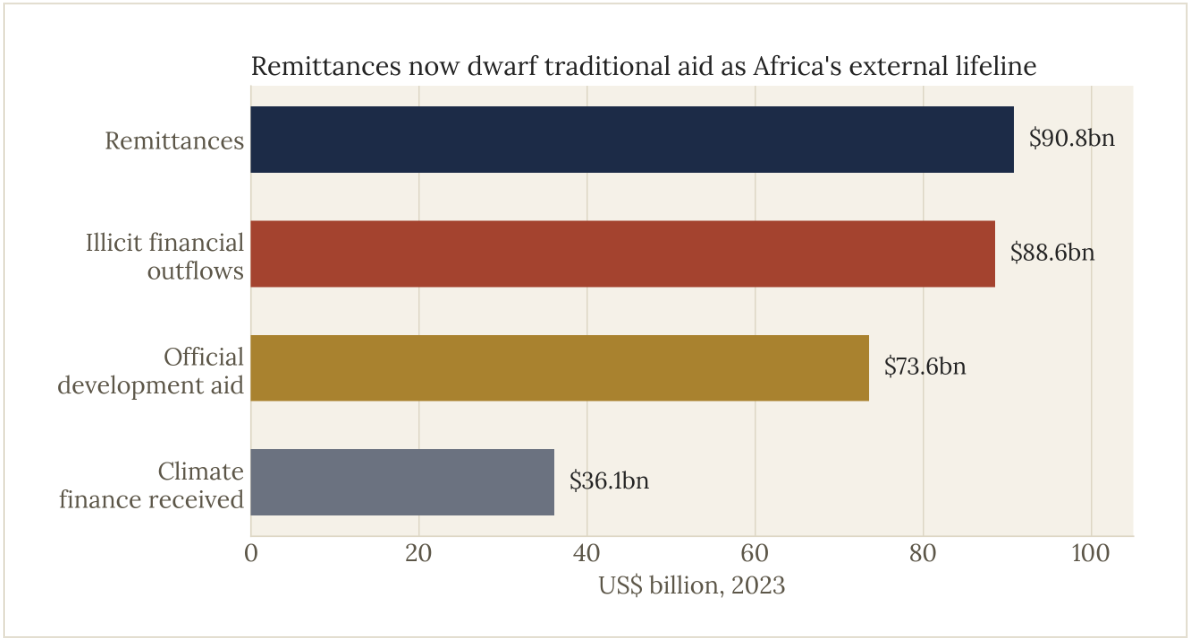
Meanwhile the composition of external capital reaching Africa has quietly inverted. Remittances to the continent reached $90.8 billion in 2023 - 11% of the global total - now larger than official development assistance, which stood at $73.6 billion and has fallen from 37.6% of global aid flows in 2013 to 26.7% in 2023.20 Foreign direct investment, meanwhile, is the volatile leg of the stool: continental inflows fell 42% year-on-year to $28 billion in the first half of 2025 alone.21 Illicit financial outflows from the continent, estimated at $88.6 billion a year, now roughly match the entire aid budget flowing the other way.22

Figure 6
Figure 6. External capital flows into Africa, 2023 ($bn). Source: Mo Ibrahim Foundation, "Facts & Figures, May 2025"; figures reflect differing methodologies across categories and should be read as orders of magnitude rather than a single reconciled ledger.

Read plainly, these numbers say something uncomfortable and something hopeful in the same breath. Uncomfortable, because aid - the traditional mechanism through which the world has financed African development - is shrinking in real terms and shrinking as a share of what the continent actually needs. Hopeful, because private commerce, remittances and mobile-enabled capital have already, on their own, outgrown it. The animating idea of this paper follows directly from that shift: the paper's job is not to argue that Africa needs more aid. It is to argue that a very large amount of patient, risk-tolerant capital has already been committed to the continent by exactly the institutions built to provide it - and that the binding constraint today is not the size of that commitment. It is what has happened to it since.

That is the subject of Part II.

THE CAPITAL IS THERE · AFRICA'S DECADE AHEAD

II. From Trapped Value to Governed Equity

The patient capital Africa needs for the next decade does not need to be raised from nothing.

Much of it already exists, sitting immobilised on development balance sheets. The work is converting it - from impaired claim to governed, compounding equity - and holding it long enough for that conversion to pay off.

The residue on the balance sheet

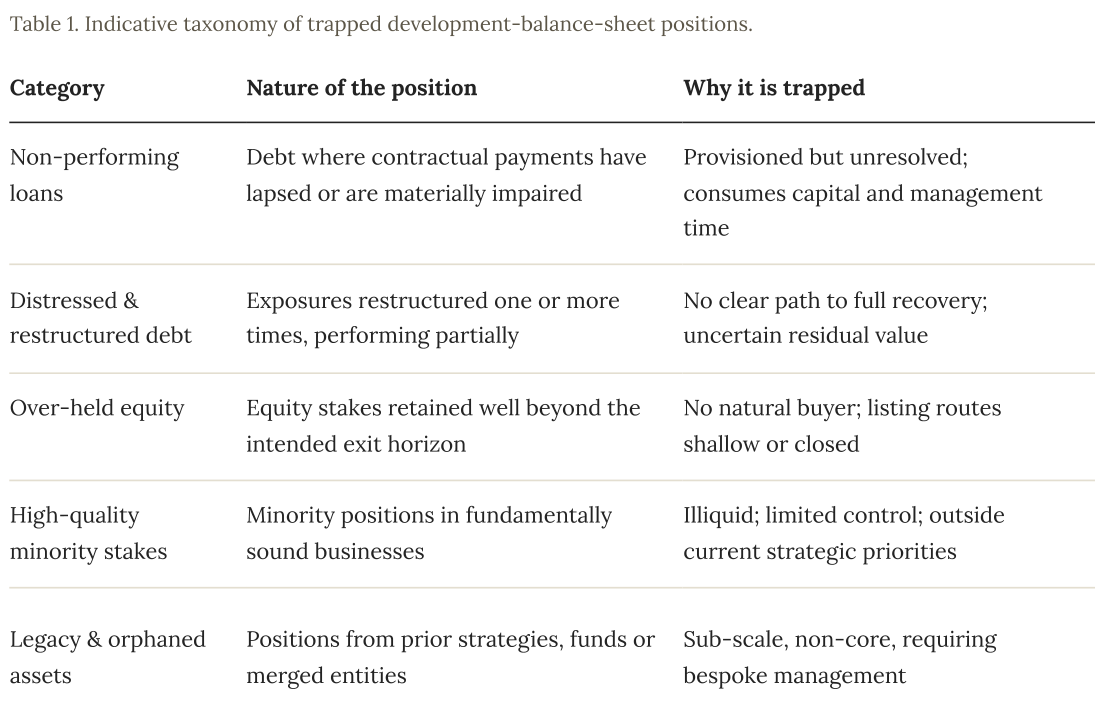
Development finance institutions exist to take risk that commercial capital will not. They lend to first-of-a-kind projects, capitalise companies in frontier markets, and hold equity through cycles that would deter a conventional fund. That mandate is essential, and it is precisely why their balance sheets accumulate a distinctive set of positions over time. Some loans are restructured once, then again, and settle into a long twilight of partial performance. Some equity stakes, taken to catalyse a business, remain in place a decade later because no natural buyer has emerged. Some minority positions sit in companies performing well but no longer aligned with a sponsor's evolving country or sector strategy.

Individually, each of these positions has a rationale for remaining where it is. Collectively, they represent a significant store of value that is neither generating the returns of a healthy investment nor available for redeployment into the next generation of development priorities. The capital is committed. It is not free.

Table from the original report

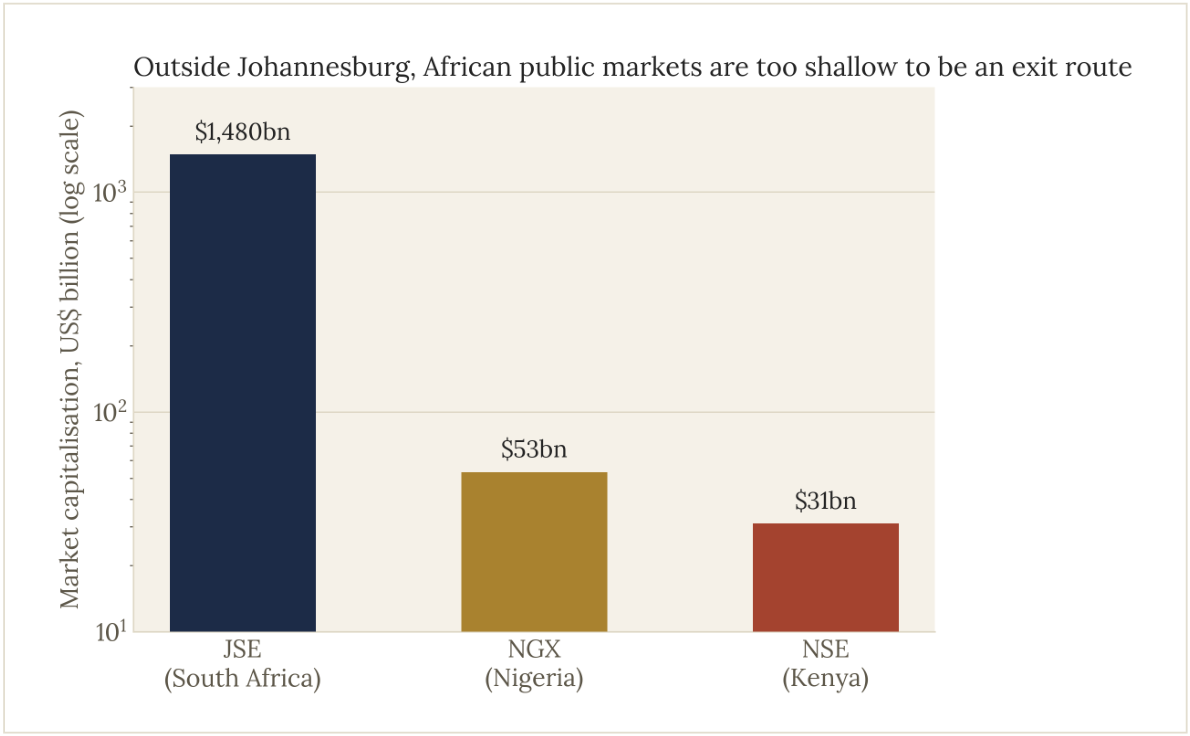
The constraint is structural rather than a reflection of asset quality. African secondary markets for private positions are thin. Strategic buyers willing and able to acquire a DFI's stake at fair value are scarce. Public equity markets across much of the continent are shallow and episodic, making initial public offerings an unreliable exit route. This is not a claim requiring much imagination to verify: the JSE alone carries a market capitalisation of roughly $1.48 trillion, dwarfing the Nigerian Exchange's roughly $53 billion and the Nairobi Securities Exchange's roughly $31 billion combined many times over.1 Outside Johannesburg, there is, in the most literal sense, nowhere to sell most of this.

Figure 7
Figure 7. Market capitalisation of major African stock exchanges, log scale. Sources: JSE Limited (Jan. 2026); NGX Group via Nairametrics (Jan. 2026); Nairobi Securities Exchange via Kenyan Wall Street (2026).

The result is that holding periods stretch far beyond original intentions, and the management attention required to steward these positions competes directly with each institution's forward-looking mandate. Across African private equity broadly - not development finance

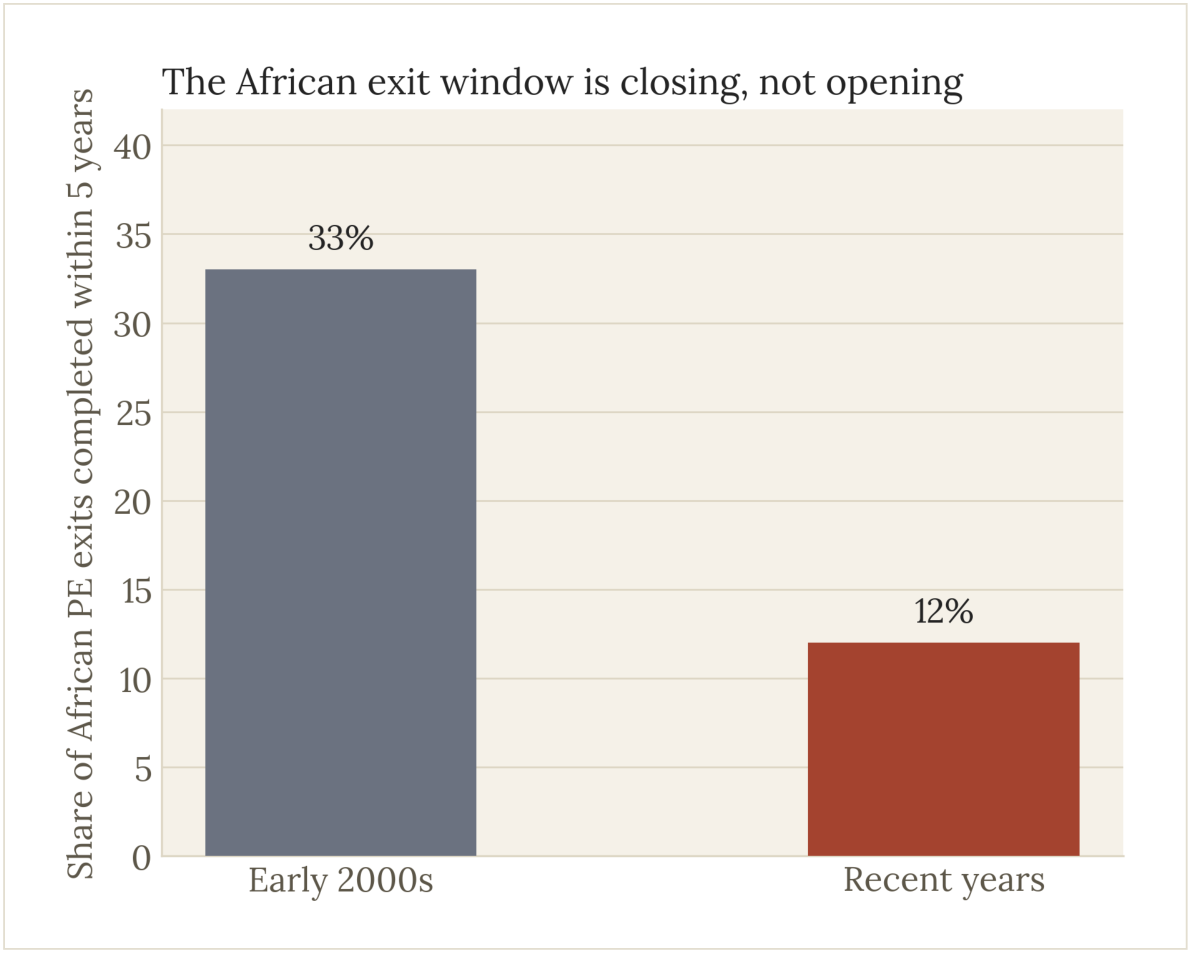
alone, but the closest market-wide proxy available - the average holding period now runs 6.4 years, and the share of exits completed within five years has fallen from 33% in the early 2000s to just 12% today.2 Only 32% of African private equity exits between 2000 and 2023 were secondary sales to another financial sponsor, against 45% globally - a structural gap in the exit routes that exist everywhere else.3 The exit window on the continent is not opening. It is closing.

Figure 8
Figure 8. Share of African private equity exits completed within five years. Source: AVCA data via ImpactAlpha.

This is not a hypothetical market - a version of it already exists

The instinct to doubt that a market this specific could really be under-served is a reasonable one, so it is worth being precise about what already exists and what does not.

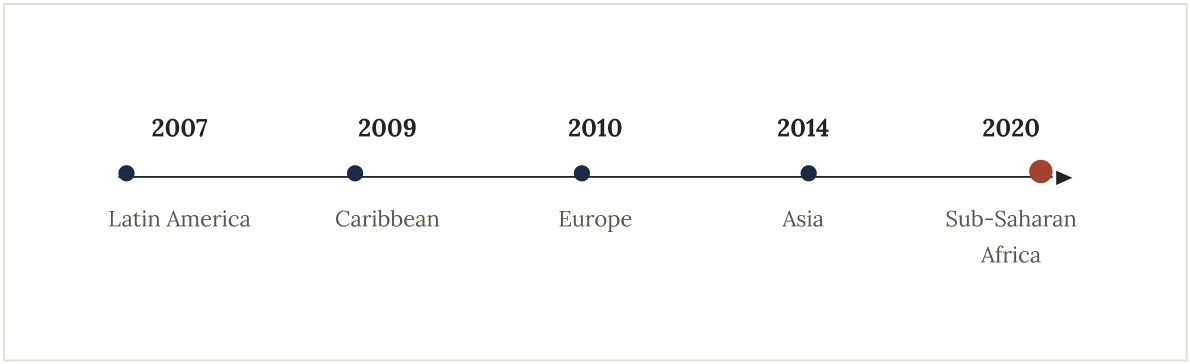
The single closest precedent is IFC's own Distressed Asset Recovery Program, launched in 2007 to acquire and resolve non-performing loans, initially in Latin America. It has since

expanded to the Caribbean (2009), Europe (2010), Asia (2014) and - only in 2020 - Sub-Saharan Africa. Across all regions it has committed a cumulative $10.2 billion (a $3.4 billion own-account commitment mobilising a further $6.7 billion in third-party capital), addressing more than $49 billion in unpaid principal across 330-plus acquired portfolios.4 Africa currently represents roughly 6% of the programme's total activity - the newest and smallest region it operates in.5 This is, in effect, the world's own development finance system telling us two things at once: the model of acquiring and resolving distressed development-linked exposures works well enough that the IFC has run it globally for close to two decades - and Africa is where it is least built out.

2007 2009 2010 2014 2020

Latin America Caribbean Europe Asia Sub-Saharan

Figure 9
Figure 9. IFC's Distressed Asset Recovery Program: geographic expansion, 2007–2020. Africa is the programme's newest region and, at roughly 6% of cumulative activity, its smallest. Source: IFC, "Distressed Asset Recovery Program Overview," 2024.

A second, cautionary precedent sits closer to home. Nigeria's Asset Management Corporation (AMCON) was established in 2010 to absorb non-performing loans following the country's 2009 banking crisis, acquiring assets with a face value of ₦1.7 trillion at inception. Fifteen years later, more than ₦1 trillion of eligible bank assets remain outstanding and unresolved.6 AMCON demonstrates that the underlying problem - impaired development-linked and bank credit needing a dedicated, disciplined resolution vehicle - is real and large. It also demonstrates the risk of getting the vehicle's structure wrong: a state-directed, politically entangled bad bank without a hard governance mandate and a genuinely private, professional operating discipline can extend a workout indefinitely rather than resolve it.

India offers a more encouraging structural template. The National Asset Reconstruction Company Limited, launched in 2021 to acquire large stressed-loan accounts, pays selling banks 15% cash and 85% government-guaranteed security receipts - a partial-cash, partial-deferred-consideration structure directly relevant to how a fund might price the acquisition of a DFI's legacy book. Against a five-year target of ₹200,000 crore in acquisitions, NARCL

had reached ₹165,862 crore across thirty-three borrower entities by March 2026 - a slow start followed by a substantial catch-up, resolved through a dedicated servicing entity that runs the workouts via competitive, professional bidding rather than in-house.7

No global precedent exists, so far as we have been able to establish, for a permanent-capital vehicle purpose-built to acquire distressed debt and over-held equity directly from development finance institutions and multilateral banks, in Africa or anywhere else. That is the honest way to characterise the opportunity: the individual components - distressed-asset acquisition, debt-to-equity conversion, permanent-capital ownership - are each separately proven at scale. Their combination, aimed specifically at the DFI balance sheet, is not something anyone else is presently doing.

The mechanics of conversion

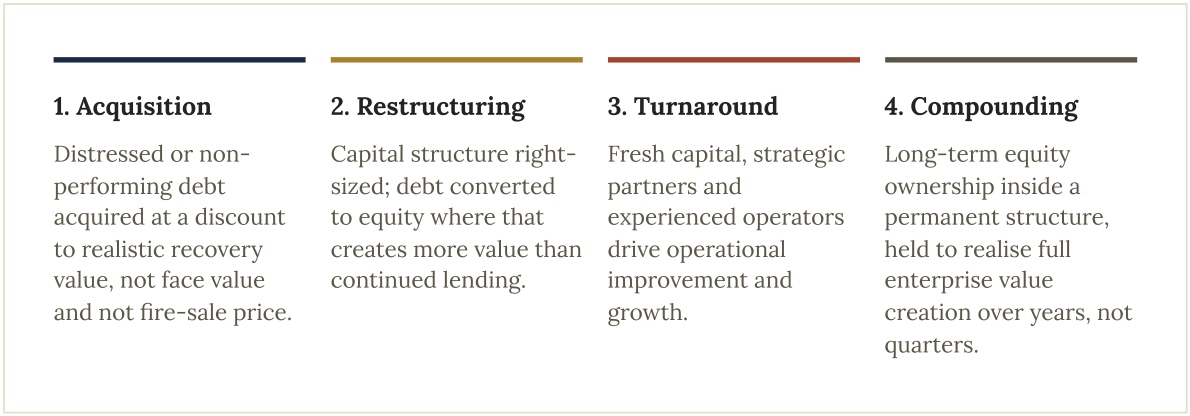
Where the underlying business is fundamentally viable, acquisition is the beginning of the value-creation process rather than the end of it. The fund restructures the capital structure to a sustainable level and converts debt to equity where doing so creates more value than continued lending. A creditor with an impaired claim becomes a shareholder with governance rights, board representation and a direct stake in the recovery. Recapitalisation transactions follow, strategic partners and co-investors are introduced, and an operational turnaround proceeds under experienced management - the company becoming, at that point, a long-term portfolio holding rather than a workout file.

1. Acquisition 2. Restructuring 3. Turnaround Distressed or non- performing debt acquired at a discount to realistic recovery value, not face value and not fire-sale price. Capital structure right- sized; debt converted to equity where that creates more value than continued lending. Fresh capital, strategic partners and experienced operators drive operational improvement and growth.

Figure 10
Figure 10. The value bridge from impaired claim to compounding equity ownership.

Why does the conversion itself create value, rather than simply changing who holds the same risk? Because it right-sizes the balance sheet so the business can invest and grow rather than service unsustainable debt; because it aligns the holder's incentives with the long-term health

of the enterprise rather than near-term cash extraction; because it converts a capped, deteriorating claim into an uncapped equity participation in the recovery; and because it brings active governance to a company that, as a distressed borrower, was very often under-supervised. This is not a novel insight invented for African assets - it is the standard playbook of distressed-for-control investing, applied with unusual discipline to a market where impaired debt, viable underlying businesses and a genuine scarcity of patient capital coincide more starkly than almost anywhere else.

The academic evidence for the underlying mechanism is close to as good as corporate-finance research gets. A study of 2,156 leveraged-loan borrowers between 1997 and 2010, including 991 private-equity-backed firms, found that PE-backed distressed companies restructure 36% faster than comparable non-PE-backed firms, resolve 52% of defaults out-of-court or via pre-negotiated bankruptcy (against 36% for non-PE firms), and are 8% more likely to survive as a going concern. Private equity owners retained control in 18% of restructurings, versus just 4% for non-PE owners - direct evidence that control investors are disproportionately the ones who convert debt into equity through restructuring, and that doing so measurably improves outcomes for the underlying business.8

Why permanence compounds

Our favorite holding period is forever.

Warren Buffett
Berkshire Hathaway, Chairman's Letter to Shareholders, 1988

The case for converting distressed debt into equity is only half the argument. The other half is what structure should hold the resulting equity - and here the evidence is unusually direct, because a small number of permanent-capital vehicles have spent decades publishing exactly the numbers this question turns on.

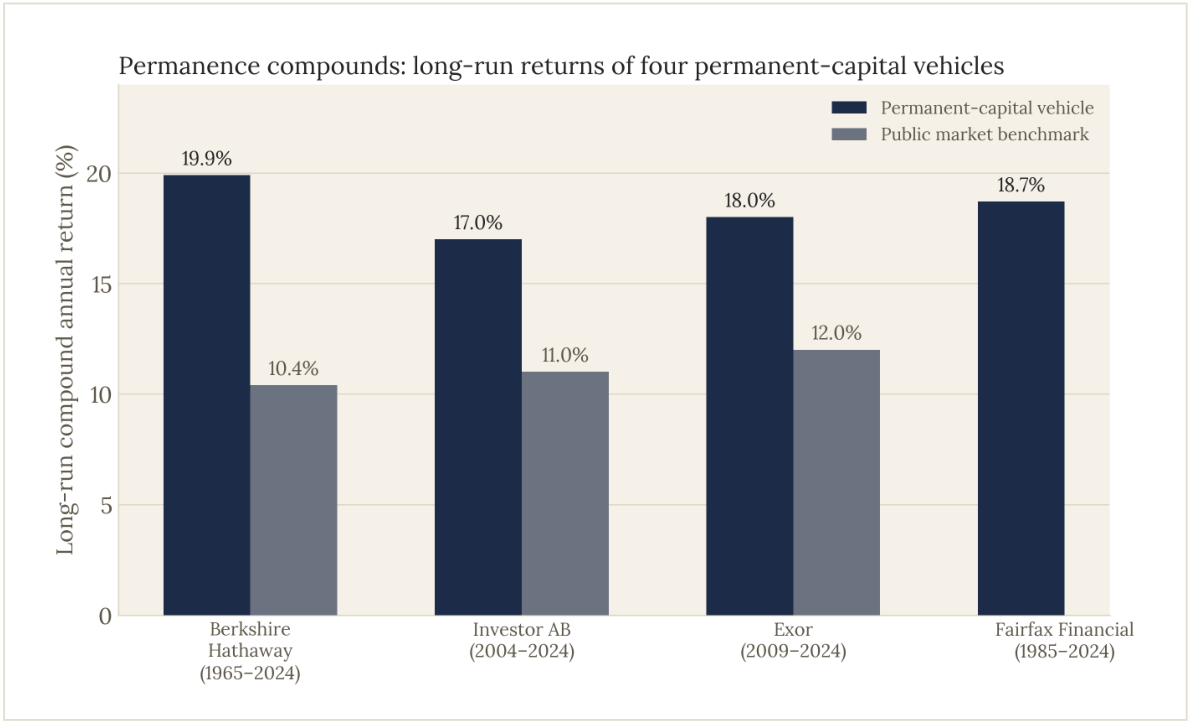
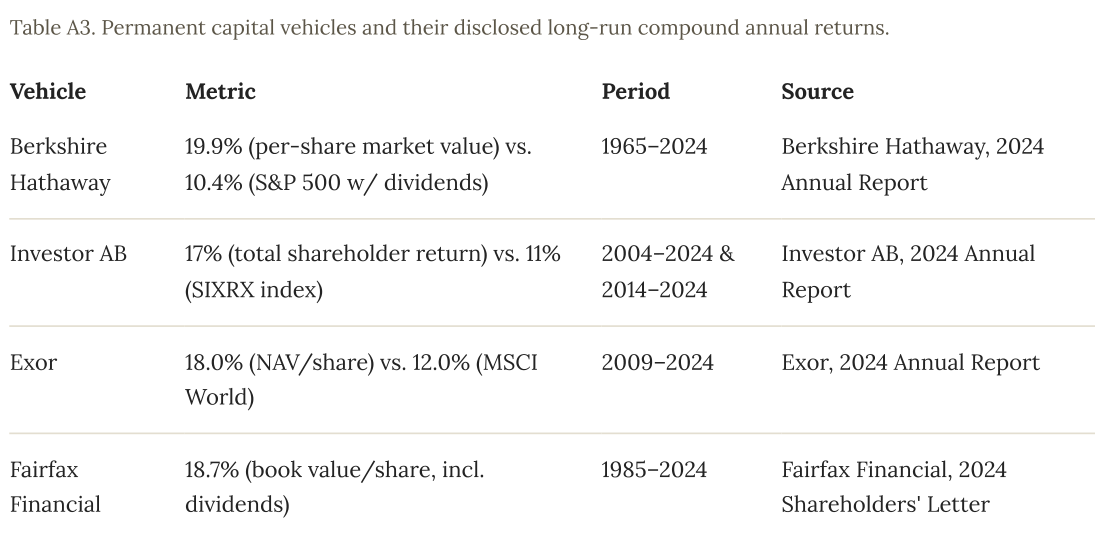
Berkshire Hathaway's per-share market value has compounded at 19.9% annually since 1965, against 10.4% for the S&P 500 with dividends reinvested - a gap sustained across sixty years.9 Sweden's Investor AB, the Wallenberg family's holding company, has returned 17% annually over both the past ten and twenty years, against 11% for its benchmark index.10 Exor, the Agnelli family's vehicle, has compounded net asset value per share at 18.0% since its 2009 Euronext Milan listing, against 12.0% for the MSCI World.11 Fairfax Financial's book value per share has compounded at 18.7% annually, including dividends, since 1985.12

Figure 11
Figure 11. Long-run compound annual returns of four permanent-capital vehicles against their disclosed benchmarks. Sources: company annual reports and shareholder letters, as cited above.

These vehicles have almost nothing in common sector-wise - insurance and railroads, Nordic industrials, European luxury and automotive holdings, insurance and reinsurance again. What they share is structural: no fixed fund life, no obligation to distribute realised gains rather than reinvest them, and a governing board answerable to permanent shareholders rather than to a partnership agreement with a maturity date. The mechanism is not mysterious. It is the simple, compounding arithmetic of never being forced to sell a good asset on somebody else's calendar.

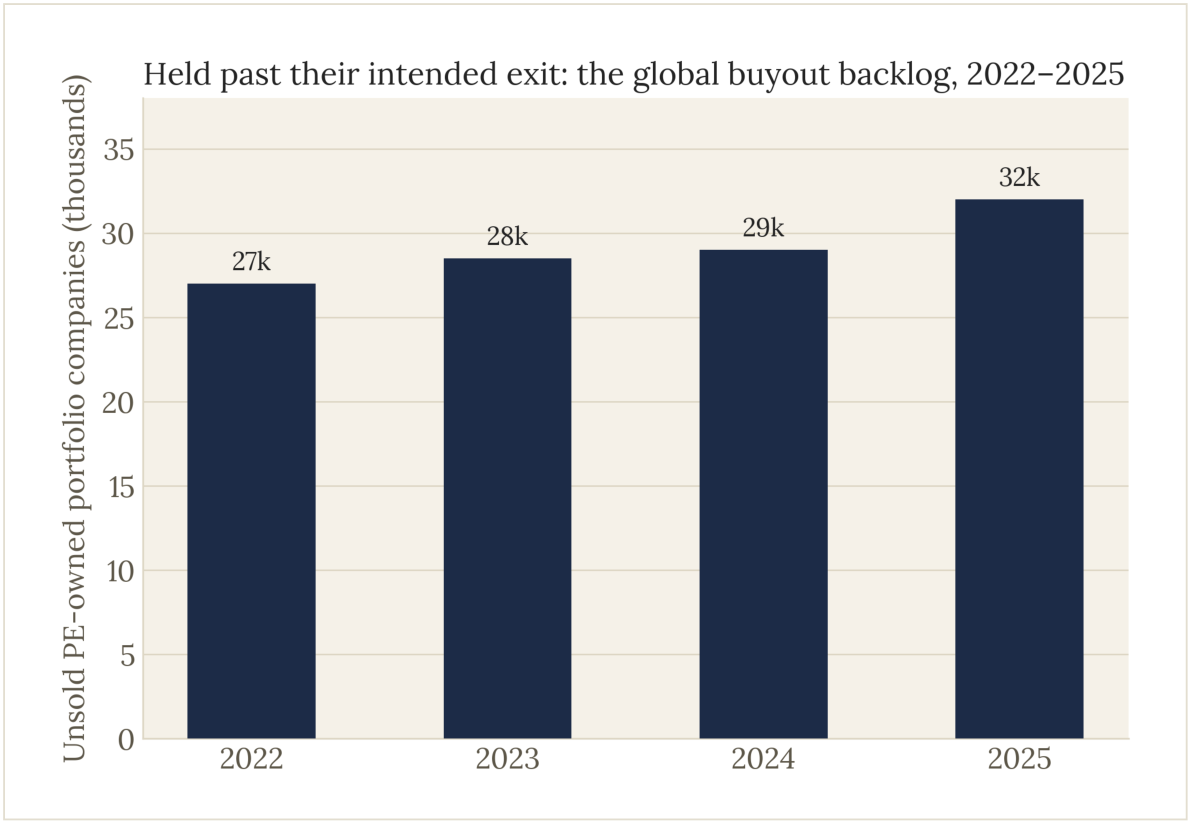
The scale of that "somebody else's calendar" problem, globally, is larger than most limited partners appreciate. Bain & Company's 2026 Global Private Equity Report counts 32,000 unsold portfolio companies worldwide, worth $3.8 trillion, currently held by private equity funds beyond their intended exit - up from 29,000 companies worth $3.6 trillion the year before.13 Average buyout holding periods at exit have stretched to roughly seven years, up from five to six years across 2010– 2021, and distributions to limited partners fell to just 14% of net asset value in 2025 - the lowest level since the 2008–09 financial crisis.14 The industry's own response has been telling: continuation-vehicle transaction volume reached roughly $63 billion in 2024, nearly tripling in five years, precisely because general partners need a

mechanism to keep holding good assets rather than sell them into a depressed market on a fixed clock.15 When offered the option, roughly 90% of limited partners elect to take the liquidity a continuation vehicle provides rather than remain locked into the old fund16 - an industry-wide referendum, in effect, on how much investors value permanence once someone finally offers it to them. Global private markets are quietly re-engineering their way toward permanent capital because the alternative is proving too costly. This paper proposes building that way from the outset, for a market where the mismatch between asset duration and fund duration is more severe than almost anywhere else.

Figure 12
Figure 12. Unsold, PE-owned portfolio companies held globally past their intended exit, 2022–2025 (illustrative build-up to the disclosed 2025 total of 32,000 companies worth $3.8 trillion). Source: Bain & Company, Global Private Equity Report 2026.

What distressed-to-equity investing actually returns

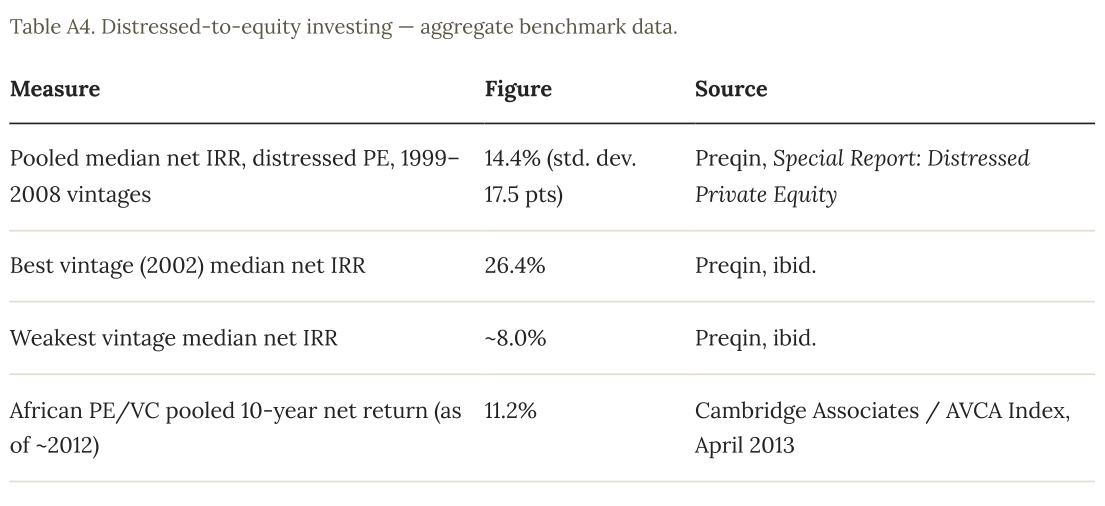
The return profile of distressed-for-control investing is real but genuinely dispersed, and a credible paper should show the dispersion rather than the best year. Preqin's benchmark data across distressed private equity fund vintages from 1999 to 2008 shows a pooled median net

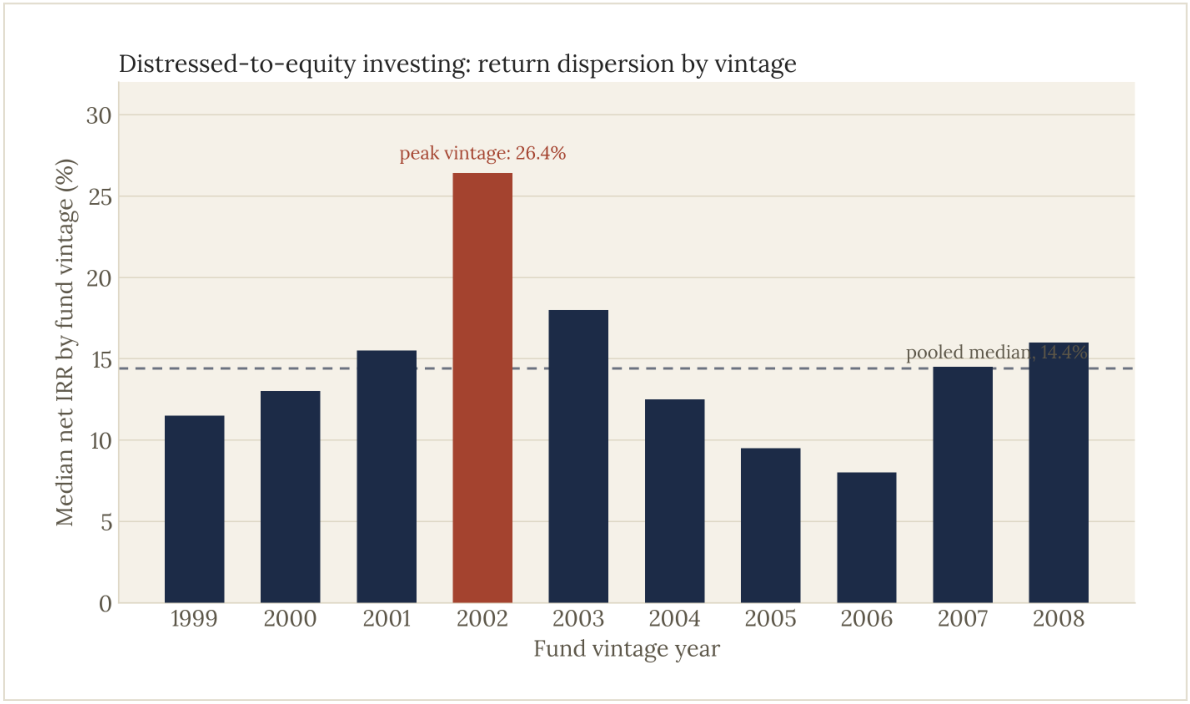
IRR of 14.4%, with a standard deviation of 17.5 percentage points - the widest dispersion of any private equity strategy Preqin tracks. The best individual vintage, 2002, posted a median net IRR of 26.4%, precisely because it was deployed into the aftermath of the early-2000s credit cycle; the weakest vintages, deployed at less favourable points in the cycle, returned closer to 8%.17 Distressed strategies deployed into genuine dislocation - the Global Financial Crisis vintages among them - have historically outperformed buyout and growth strategies of the same vintage year.18

Figure 13
Figure 13. Distressed private equity, median net IRR by fund vintage year. Source: Preqin, Special Report: Distressed Private Equity.

The lesson from that dispersion is not that distressed investing is unreliable - it is that entry discipline and vintage timing matter enormously, which is exactly why this paper does not propose raising a single closed-end fund to deploy into whatever the market offers over a fixed investment period. It proposes a permanent platform that can acquire opportunistically, across cycles, at the pace the market actually presents them, and hold the resulting equity for as long as the underlying business needs to compound - a structure built to capture the upper end of that return distribution rather than be a hostage to whichever vintage year it happens to be born in.

African private equity's own aggregate return history, where it is public at all, is thinner and more dated than one would like: a Cambridge Associates / AVCA benchmark of forty institutional-quality funds showed an 11.2% annualised ten-year return as of September 2012;

the same benchmark series showed pooled ten-year net returns of just 5.47% by around 2016.19 AVCA's more recent flagship activity reports track fundraising, deal and exit volumes in detail but no longer publish comparable IRR benchmarks, and no African-focused manager we are aware of - including well-regarded names such as Helios Investment Partners, AfricInvest, Development Partners International and Vantage Capital - discloses fund-level return figures publicly.20 We record this candidly rather than paper over it: African private capital performance data is genuinely opaque, which is itself part of the opportunity this paper describes - a disciplined, permanent, professionally governed platform that reports transparently would be filling a gap the market has not yet filled for itself.

The economics, in other words, are not the hard part. The hard part - and the honest one - is everything covered in Part III.

THE CAPITAL IS THERE · AFRICA'S DECADE AHEAD

III. The Challenges

None of this is easy, and a paper that pretended otherwise would not survive a single credit committee.

Four questions have to be answered honestly: why a ten-year fund is the wrong vehicle, how the downside is actually controlled, why this should be a platform rather than a fund, and why the next few years - not the next decade - are the ones that matter.

It would be easy to stop at Part II. The demographic case is real, the trapped-value thesis is real, and the return precedents for both permanent capital and distressed-to-equity investing are well documented. But an investor who has sat through even one African credit committee knows that a compelling thesis and an investable structure are different things. This part addresses the four questions that determine whether they are the same thing here: the right time horizon, the discipline that controls the downside, the right organisational form, and the reason timing matters as much as structure.

IIIa. Why ten years is the wrong horizon

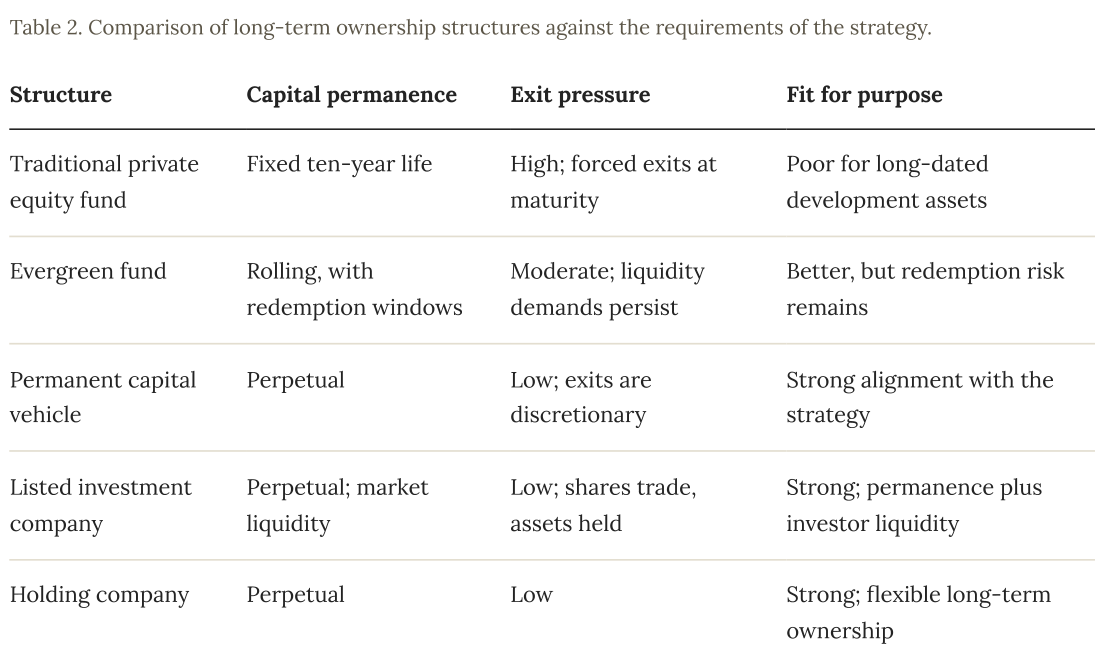
African development assets, particularly those that have been distressed, restructured or held through difficult cycles, do not conform to a ten-year clock. Turnarounds take time. Recapitalised businesses need years, not quarters, to rebuild. Infrastructure and agribusiness assets generate their returns over long horizons. A conventional closed-end private equity fund, with its fixed life and its obligation to return capital by a set date, is fundamentally misaligned with these realities.

The misalignment is not merely inconvenient - it destroys value. A fund approaching the end of its life becomes a forced seller, exiting assets when its calendar dictates rather than when value is maximised. This dynamic transfers value from the fund to the buyer, and pressures managers toward financial engineering over patient operational improvement. For assets where the realisation of value and impact is inherently long-dated, the cost of an artificial deadline is especially high - and, as Part II showed, the industry's own scramble toward continuation vehicles is a $63-billion-a-year admission that the conventional model breaks down in exactly this way, globally, even in developed markets with deep secondary buyer pools. In Africa, where secondary buyer pools are thinner still, the same forced-exit dynamic is worse, not better.

Table from the original report

We recommend a permanent capital vehicle organised around a holding company at the apex, with the option of a public listing as the platform matures - a dual-vehicle approach that combines the permanence of perpetual capital with a route to liquidity for investors who require it. The holding company owns the portfolio of converted, acquired and consolidated assets and reinvests realised proceeds rather than distributing them on a fixed schedule, allowing value to compound. Limited partners and cornerstone investors hold interests in the vehicle, and over time a listing can provide tradeable exposure without forcing the sale of underlying assets. It is the model Berkshire Hathaway, Investor AB, Exor and Fairfax Financial have each used, in their own markets, to build the durable, compounding franchises documented in Part II - adapted here to the specific needs of African development assets.

IIIb. Locking down the downside

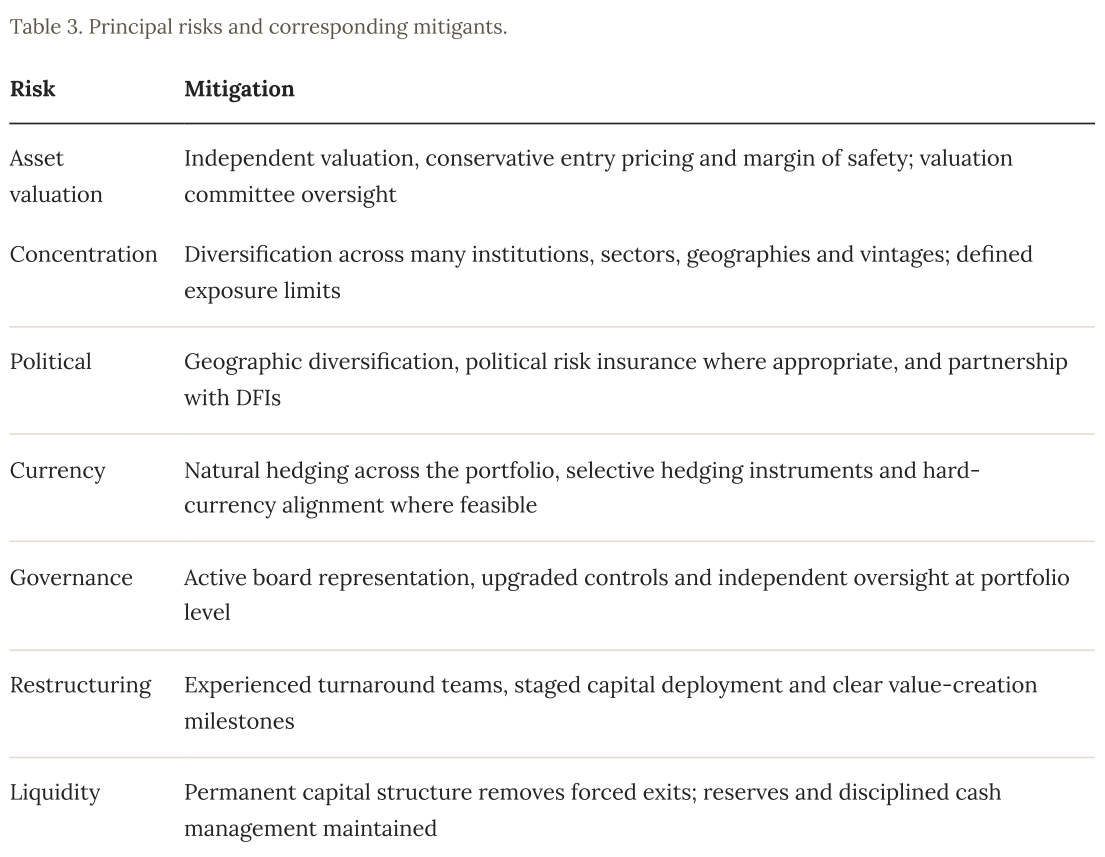
Acquiring and restructuring development assets carries real risks, which the Fund is designed to manage deliberately rather than assume away.

Table from the original report

The permanent capital structure itself deserves particular emphasis as a risk mitigant, not merely a return enhancer. By removing the obligation to exit on a fixed timetable and reducing reliance on refinancing windows, it eliminates two of the most common sources of value destruction in conventional funds. The Fund can hold through volatility, support portfolio companies through difficult periods, and transact when conditions are favourable rather than when a calendar demands it.

Governance is designed to meet the standards development finance institutions and multilateral investors expect as a baseline, not as a concession. Shiloh Capital acts as general partner and manager, accountable for investment decisions and portfolio performance within defined mandates; DFIs and other investors hold limited partner interests with defined rights, including representation on an advisory board; an investment committee approves all acquisitions, restructurings and material transactions against the Fund's mandate and risk limits; a valuation committee oversees independent, consistent valuation using recognised methodologies; an ESG committee oversees impact measurement and the preservation of development objectives; and independent directors bring outside judgement to the holding company board and its key committees. Institutional-grade financial and impact reporting is provided on a regular cycle, aligned to recognised standards.

Impact is preserved by the same discipline, not bolted on afterward. Every portfolio company is assessed against a tailored set of impact indicators at acquisition - covering employment, production, access, governance and environmental performance - measured against a

baseline and reported to investors on a regular cycle, using recognised impact-measurement frameworks. The Fund's activities are mapped against the Sustainable Development Goals its underlying sectors touch most directly: zero hunger (agribusiness turnaround and growth capital), good health and well-being (preserving healthcare and pharmaceutical capacity), quality education (skills, training and education-linked enterprises), gender equality (gender-inclusive governance and employment practice), affordable and clean energy (stewarding energy and electrification assets), decent work and economic growth (preserving and creating jobs through enterprise continuity), industry, innovation and infrastructure (recapitalising manufacturing, beneficiation and infrastructure assets), responsible consumption and production, and climate action. Development covenants are carried forward into new ownership rather than left to chance, and ESG considerations are integrated into diligence, the investment decision and ongoing monitoring - so that impact and risk are managed together rather than in isolation.

IIIc. The platform, not the fund

The proposition set out in this paper is easy to mistake for a one-time transaction - a fund that buys a defined book of distressed assets, works through it, and closes. That would be a misreading of both the opportunity and the structure required to capture it.

Development institutions hold portfolios numbering in the hundreds of positions each, and they continually originate new exposures that will, in time, require management or exit. A vehicle that earns a reputation as a fair, professional and impact-aligned counterparty becomes the natural first call for the next transaction, and the one after that. Each successful transaction builds the relationships, the proprietary knowledge of specific institutions' portfolios, and the institutional trust that make the next transaction easier to originate and better to price. This is precisely the mechanism visible in IFC's own Distressed Asset Recovery Program, discussed in Part II: a programme that began in one region in 2007 has spent eighteen years compounding relationships and expertise into a $10.2 billion cumulative platform spanning five regions. The proposition here is the African-specific, DFI-focused equivalent - aimed from inception at the region where that model is least built out.

Structured this way, the Fund aims to occupy four defining positions in the market simultaneously: the preferred buyer of DFI assets, the preferred restructuring partner for distressed development exposures, the preferred turnaround investor for viable but troubled businesses, and the long-term owner of strategically important African enterprises. Each role reinforces the others, and together they create a durable competitive position - a flywheel in which transactions build trust and data, trust and data improve access and pricing, and better

access and pricing generate more transactions. Over time, the platform aggregates a diversified, continental portfolio of development assets that no single fund vintage could assemble on its own, with an information and relationship advantage that is difficult for a new entrant to replicate quickly.

IIId. Africa must not be left waiting

Everything in this paper works on a timetable, and the timetable is not generous. Part I established that Africa's growth curve, its digital adoption and its demographic dividend are not forecasts requiring anyone's faith - they are already in motion. That is precisely why the next few years matter more than the ones after them. A working-age population does not wait for financing architecture to catch up with it; it either finds productive employment during its dividend window, or the window narrows as the same population ages without having been financed into productivity. Africa's median age is roughly 19 years against roughly 43 in Europe1 - a gap this stark closes only once, and only if the capital is in place while it is open.

The same urgency applies to the balance-sheet problem this paper is centred on. Every year that trapped value remains trapped is a year of foregone compounding, a year of management attention diverted from new development priorities, and a year in which the institutions holding these positions carry them at a cost - in provisions, in capital charges, in opportunity - that a professional, permanent owner would not. The AfDB's own $50–90 billion annual infrastructure financing gap, set out in Part I, will not close through aid, which is shrinking, nor through foreign direct investment, which is volatile and itself fell 42% in the first half of 2025 alone.2 It closes, if it closes at all, through the private mobilisation of capital that is already committed to the continent but presently immobilised - precisely the capital this paper is about.

There is also a plainer, more competitive way to state the same point. The individual components of this strategy - distressed-asset acquisition, debt-to-equity conversion, permanent capital - are proven, well-understood tools that global capital already uses everywhere else. Applying them systematically to African development assets is, at the time of writing, something nobody else is doing at scale. That is a genuine first-mover position, and first-mover positions in finance do not stay open indefinitely. IFC needed thirteen years to expand its own distressed-asset programme from Latin America to Sub-Saharan Africa. The institution, the relationships and the platform that establish themselves as the preferred counterparty for this specific market over the next several years are likely to hold that

position for a long time afterward - and the institution that waits for someone else to prove the model first will be negotiating as the second call, not the first.

None of this requires anyone to bet on Africa's story changing. It requires someone to be positioned to act on the version of it that is already true - which is the subject of Part IV.

THE CAPITAL IS THERE · AFRICA'S DECADE AHEAD

IV. The Fund

A concrete proposal: the African Development Assets Permanent Capital Fund, the role Shiloh Capital proposes to play in it, five low-friction routes for a founding institution to participate, and an honest sizing of the opportunity.

Everything in Parts I through III is analysis. This part is the proposal: the African Development Assets Permanent Capital Fund, a permanent capital investment vehicle established to acquire, restructure, consolidate and actively manage assets currently trapped on the balance sheets of African development finance institutions and their peers - designed as a repeatable, scalable exit and restructuring solution that releases capital for redeployment while preserving and extending developmental impact.

An integrated mandate

Shiloh Capital was founded in 2015 on a simple conviction: that the patient, disciplined ownership of African productive assets is among the most consequential forms of capital allocation available anywhere in the world. We propose to fulfil four distinct but connected roles in relation to the Fund, giving development finance institutions a single accountable partner across the full life of each transaction.

As strategic advisor, Shiloh Capital works with institutions to identify candidate assets, conduct portfolio reviews, design restructuring approaches and provide transaction advisory through to completion - ensuring transactions are well-structured and fairly priced from the outset. As fund sponsor, Shiloh Capital leads the formation of the Fund, manages investor relations, raises capital from limited partners and cornerstone investors, and designs the governance architecture that protects all stakeholders. As fund manager, Shiloh Capital is responsible for investment management, portfolio monitoring, value creation through operational engagement, risk management across the portfolio, and the management of eventual exits where they serve investors' interests. And as development partner, Shiloh Capital owns impact measurement and ESG implementation, ensuring the development thesis is delivered and evidenced throughout the holding period.

Five routes to participation

Institutions differ in their constraints and objectives, and the Fund is designed to meet them where they are. Five seed structures are available, each engineered to be low in friction and to convert otherwise illiquid balance-sheet value, or fresh capital, into a governed interest in a diversified platform.

Table 4. Seed investment structures available to founding institutions.
RouteMechanismPrincipal benefit to the institution
A - Asset-for-LPAsset contribution in exchange for limited partner interestsConverts illiquid positions into a diversified LP stake without cash outlay
B - Cash plus assetCash commitment combined with an in-kind asset contributionCombines fresh capital with in-kind transfer for greater scale and alignment
C - Warehouse transferA defined portfolio transferred into the Fund as a warehouse, in a single transactionMoves a defined book off balance sheet in one efficient transaction
D - Anchor cornerstoneCommitment as the Fund's anchor cornerstone investorSecures founding economics and governance influence as a lead investor
E - 100% cash (anchor investor)A cash-only commitment as the Fund's anchor investor, with no in-kind asset contribution requiredOpens anchor-level economics and governance influence to institutions and investors with no eligible legacy assets to contribute

Under Route A, the institution contributes eligible assets to the Fund in exchange for limited partner interests of equivalent assessed value - requiring no cash outlay, immediately diversifying the institution's exposure across the Fund's portfolio, and transferring active management to Shiloh Capital while the institution retains economic participation in the upside. Under Route B, the institution combines a cash commitment with an in-kind asset contribution, deepening alignment and accelerating the Fund's path to scale. Under Route C, a defined portfolio is transferred into the Fund as a warehouse in a single transaction - an efficient, comprehensive balance-sheet exit that simplifies the institution's reporting and gives the Fund an immediate, diversified base of assets to manage and grow. Under Route D, the institution commits as the Fund's anchor cornerstone investor, taking founding economics and a defined governance role - signalling confidence to other investors and aligning the founding institution with the platform's long-term success. Under Route E, an investor with no eligible legacy assets to contribute - a sovereign wealth fund, family office or institutional investor without a trapped-asset position of its own - participates on a cash-only basis, committing capital directly as the Fund's anchor investor and securing the same founding economics and governance role as Route D without requiring an in-kind contribution.

Sizing the opportunity, honestly

A precise figure for the addressable universe requires institution-by-institution analysis that only a formal portfolio review process can produce, and we are wary of the kind of false precision that undermines credibility with the audience this paper is written for. What can be

said with confidence is that the scale is large and that the patient capital already exists in concentrated form.

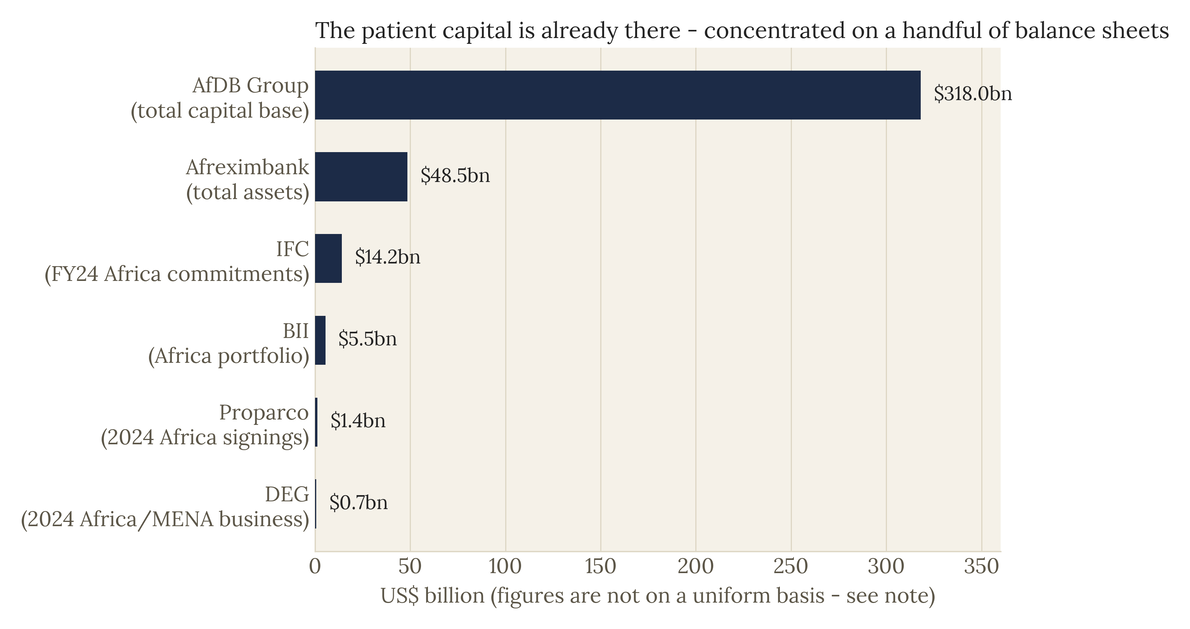
Figure 14
Figure 14. Scale of capital already committed to Africa by a sample of major development finance institutions. Figures are not on a uniform accounting basis - they mix total capital base, cumulative total assets, and single- year new-business or commitment volumes - and are shown here to illustrate order of magnitude, not to be summed. Sources: AfDB (total authorised capital, June 2024 General Callable Capital Increase); IFC (FY2024 Africa commitments); BII (2025 Africa portfolio, Key Data); Afreximbank (FY2025 total assets); Proparco and DEG (2024 Africa/MENA new business).

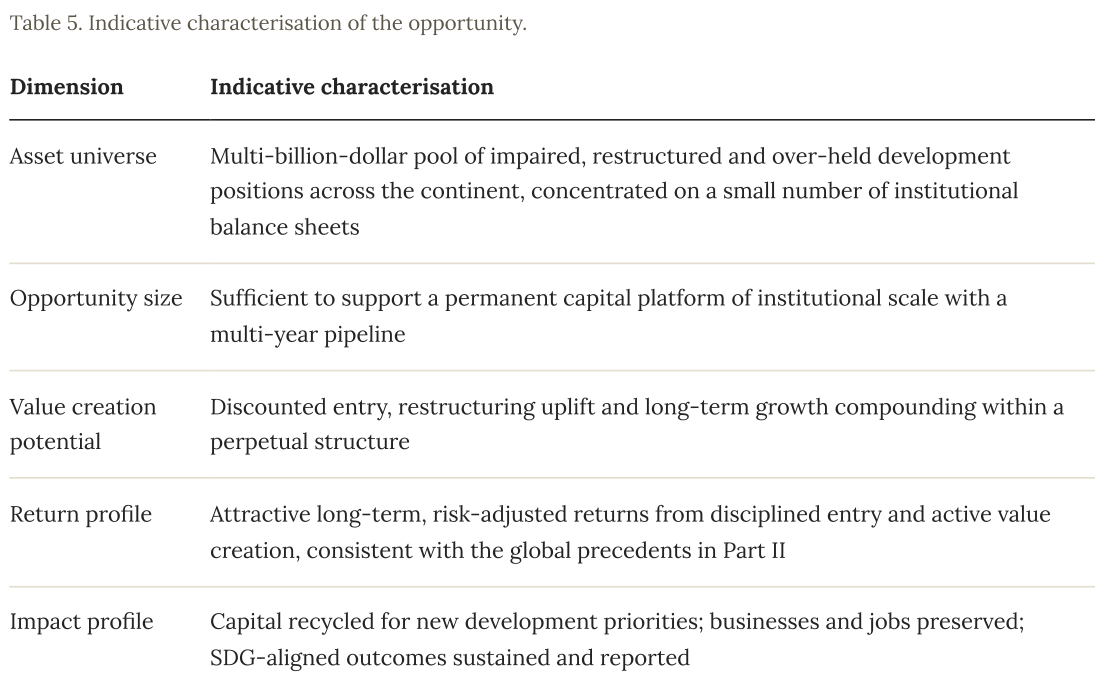
The African Development Bank Group's total authorised capital base reached $318 billion following its June 2024 general capital increase.1 IFC committed a record $14.2 billion to Africa in its 2024 fiscal year alone.2 British International Investment's Africa exposure stood at $5.5 billion, 60% of its total portfolio, across 899 African companies at the end of 2025.3 Afreximbank's total assets and contingencies reached $48.5 billion at the end of 2025.4 None of these institutions discloses, in public materials, what share of its book is impaired, restructured or held past its intended exit - a genuine information gap the market has left unfilled, rather than evidence that the pool is small. Even a conservative estimate of the trapped and addressable component of this capital, across the dozen or more institutions active on the continent, yields an opportunity measured in the billions of US dollars - sufficient to support a permanent capital platform of institutional scale with a genuine multi-year pipeline, without requiring heroic assumptions about any single institution's willingness to transact.

Table from the original report

The economic case rests on three sources of value, each addressed in detail in Part II: disciplined entry, acquiring impaired and illiquid positions at valuations that reflect realistic recovery rather than face value or fire-sale price; restructuring uplift, right-sizing capital structures and converting debt to equity to capture the recovery of viable businesses; and compounding, holding and reinvesting within a permanent structure so enterprise value can grow over years rather than being surrendered at a fund's maturity. The impact case is produced by the same discipline rather than competing with it: every transaction recycles development capital for redeployment, preserves productive businesses and the jobs they sustain, and carries forward measurable development outcomes. The financial and the developmental returns are not in tension. They are produced by the same disciplined ownership.

THE CAPITAL IS THERE · AFRICA'S DECADE AHEAD

V. Parting Thoughts

What if we're right about the decades ahead - and what happens if nobody acts on it?

What if we're right?

A working-age population of 1.6 billion people does not arrive twice. Neither does a first-mover position on a specific, financeable market opportunity that presently belongs to no one. We have tried, across the preceding four parts, to make the case for both plainly and without exaggeration - using, wherever we could, numbers that others have published and that a diligence team can check for itself rather than take on our word.

Here is what we think happens if the decade ahead unfolds the way Part I's trendlines suggest it will, and nobody builds the vehicle this paper describes. Africa's population and workforce keep growing on schedule, because demography does not wait for financing architecture. The trapped value on development balance sheets keeps growing too, because the structural constraints described in Part II - thin secondary markets, scarce strategic buyers, shallow public listings - do not resolve themselves. Development institutions keep doing what they are mandated to do, which is originate new development lending, and keep accumulating the same residue of restructured debt and over-held equity they carry today, at a larger scale, because nobody has built the standing, repeatable mechanism to relieve them of it. The financing gap the AfDB has been citing for a decade remains roughly where it is, because aid is shrinking and foreign capital is volatile, and the private capital that could fill it stays exactly where Part II found it: already committed to the continent, and still not working.

And here is what we think happens if it does get built - not as a rhetorical flourish, but as the direct, mechanical consequence of the structure set out in Part IV. A development finance institution gets the exit channel it currently lacks: a professional, permanent, impact-aligned buyer for assets it can otherwise neither hold productively nor sell fairly. Capital that has been sitting immobilised gets recycled into the institution's next generation of development lending, multiplying its developmental reach rather than merely preserving it. A distressed or over-held company gets a committed long-term owner with the patience and operating capability to see a turnaround through, rather than a slow decline under an unsustainable capital structure or an owner counting down to a fund's maturity date. And an investor gets access to a return profile - disciplined entry, restructuring uplift, long-term compounding —

that the precedents in Part II suggest can be genuinely attractive, in a market few institutional allocators are presently positioned to reach at all.

Why this, and why now

We are aware that a paper making a confident case for a specific investment thesis should be read with appropriate scepticism, and we would rather earn that scepticism's answer than avoid the question. So we will state plainly what would have to be true for this thesis to fail, because we think naming it is more persuasive than pretending it does not exist.

It fails if African development institutions decide the status quo - carrying trapped positions indefinitely - is preferable to a professionally governed, permanent alternative; we do not think this is likely, because the status quo has a real and rising cost in provisions, management attention and foregone redeployment, and because institutions like IFC have already validated the underlying model at global scale. It fails if the demographic and growth trends of Part I reverse; they have been running consistently for two decades and are underwritten by people already born, which makes a reversal a low-probability, not a zero-probability, risk - one this paper's diversification and governance discipline is built to absorb rather than ignore. And it fails if execution is poor - if valuation discipline slips, if concentration is not managed, if governance is treated as a formality rather than a genuine constraint on the manager. That risk is real in any investment vehicle, anywhere, and it is precisely why Part III spends as much time on governance and risk management as Part II spends on the return case. A thesis this specific succeeds or fails on execution, not on the argument in a concept paper - which is exactly why the next step, for any institution reading this, is a conversation about a specific portfolio, not a decision made from these pages alone.

It always seems impossible until it's done.

Nelson Mandela

We offer this paper as the beginning of that conversation, not the end of one. Shiloh Capital intends to be the long-term steward of African development assets, and the preferred strategic partner for institutions seeking balance sheet optimisation, portfolio exits, restructuring solutions and durable development impact. We do not propose a conventional ten-year fund racing toward a forced exit. We propose a permanent capital platform built to hold, to compound, and to steward - for as long as Africa's decade ahead takes to unfold, which, on the numbers in Part I, is considerably longer than ten years.

The capital, as we said at the outset, is already there. The only remaining question is who is going to be positioned to act on it.

THE CAPITAL IS THERE · AFRICA'S DECADE AHEAD

Appendix

Data tables, sourcing and methodology notes, a risk management framework, a glossary, and important information.

Table from the original report

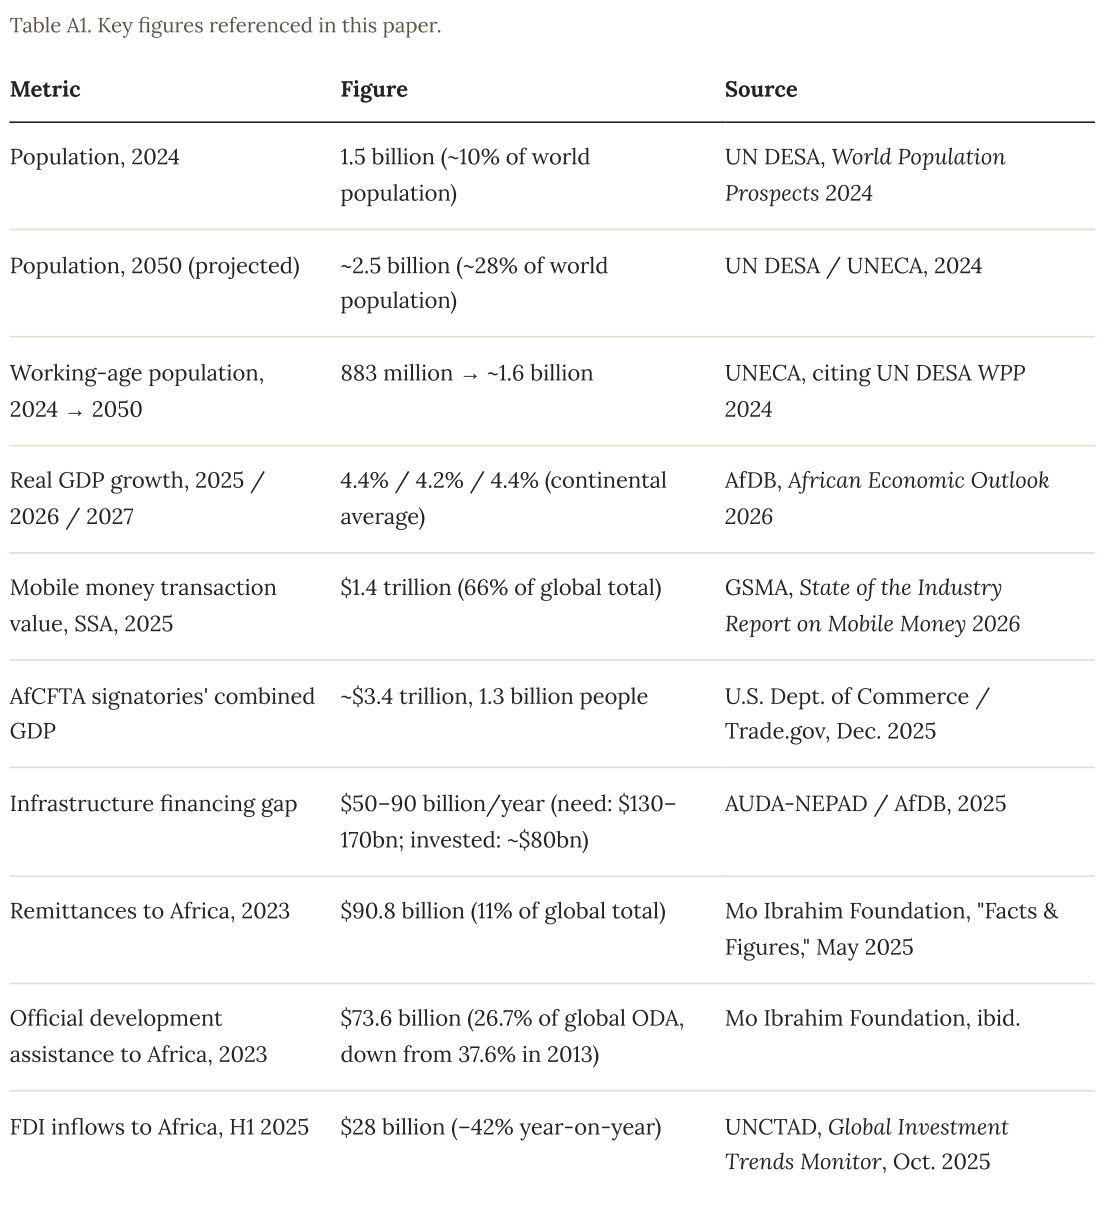
A. Africa at a glance

Table from the original report

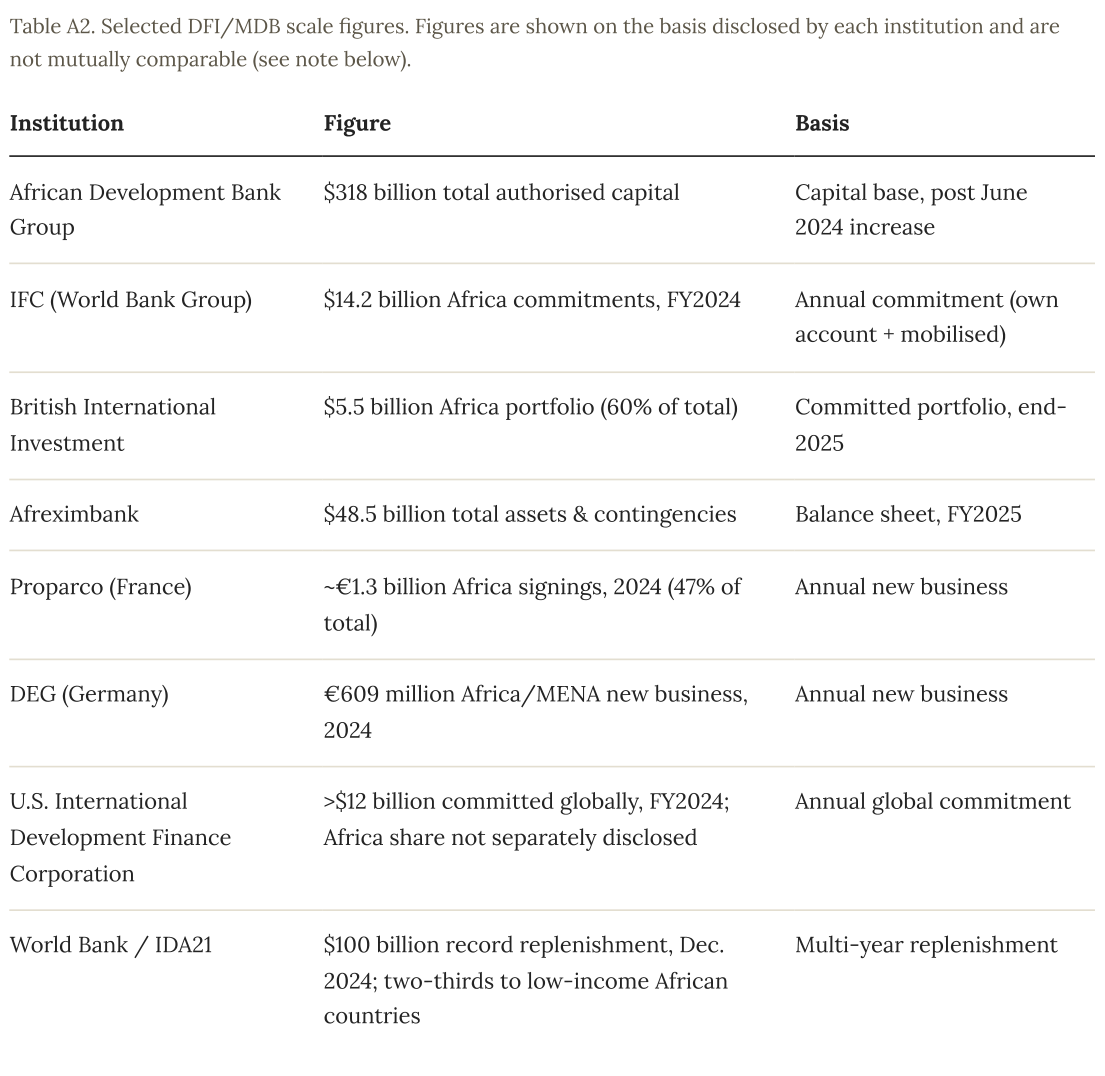
B. Development finance institutions active on the continent

Note on Table A2: these figures mix total capital base, cumulative balance-sheet assets, and single-year commitment or new-business volumes, and reflect each institution's own disclosure practice - none publishes a standardised "African trapped or restructured asset" line, which is itself a data point about how opaque this market currently is. We show the figures to establish order of magnitude, not to be summed into a single addressable-market number.

C. Return precedents cited in this paper

Table from the original report

~2016) April 2017

D. Methodology and sourcing notes

We have tried, throughout this paper, to cite a specific, checkable source for every figure, and to say plainly where public data is thin, contested or unavailable rather than fill the gap with false precision. A reader who intends to rely on this paper in an investment-committee context should be aware of the following specific points, each of which we flag here in the interest of transparency:

Africa's nominal GDP. Sources diverge materially - the Mo Ibrahim Foundation cites $2.78 trillion for 2024, while IMF World Economic Outlook figures compiled by third parties suggest a higher $3.1–3.6 trillion range for 2024–25. We have not attempted to reconcile these in this paper and would recommend pulling the primary IMF WEO database directly for any calculation that depends on a single figure.

Urbanisation. The OECD's 2025 estimate (roughly 700 million urban Africans today, doubling to 1.4 billion by 2050) and UN-Habitat's longer-range estimate (roughly two-thirds urbanised by 2050) imply somewhat

different trajectories. We have presented both rather than picking one.

DFI legacy-asset disclosure. No development finance institution reviewed in preparing this paper publicly discloses the share of its portfolio that is non-performing, restructured or held past its intended exit horizon. This is a genuine gap in market transparency, not a number we have chosen to omit - and it is itself part of the case for the platform this paper proposes, which would report on exactly this basis.

African manager-level returns. Fund-level IRR and multiple data for named African private equity and credit managers is not, to our knowledge, publicly disclosed by any manager active on the continent. The aggregate Cambridge Associates / AVCA benchmark cited in Table A4 is the most recent comparable series we were able to locate, and it is more than a decade old at its most recent data point.

E. Risk management framework

Part III sets out the principal risks the Fund is designed to manage and the outline of the governance built to manage them. This appendix sets out that framework in fuller detail: the risk appetite that governs how much of each risk the Fund is prepared to carry, the three lines of defence through which risk is owned and controlled, and the expanded risk register against which the investment committee, the valuation committee and the ESG committee report.

Risk appetite. The Fund's risk appetite is deliberately asymmetric: it is prepared to underwrite complexity - distressed positions, restructuring risk, thin secondary markets - in return for a demonstrable margin of safety at entry, but it maintains firm limits on single-institution, single-sector and single-country concentration, and it will decline transactions that cannot be independently valued or that would compromise the development mandate of the underlying asset. Risk appetite is reviewed by the investment committee at least annually and whenever the Fund enters a new country or sector for the first time.

Three lines of defence. Deal teams and portfolio operators form the first line, responsible for identifying and managing risk in the ordinary course of sourcing, structuring and stewarding each asset. The investment committee, the valuation committee and the ESG committee form the second line, setting policy, approving transactions against defined mandates and risk limits, and testing first-line judgement independently of the individuals who originated it. Independent directors on the holding company board, together with the external auditor and, where appointed, an internal audit function, form the third line, providing assurance that the first two lines are operating as designed. No transaction proceeds without first- and second-line sign-off, and material findings from the third line are reported directly to the board rather than filtered through management.

Table A5. Risk taxonomy, ratings and governance.
RiskDescriptionLikelihoodImpactPrimary mitigantOwner & monitoring cadence
Asset valuationEntry or carrying value diverges from realisable value in a thin secondary marketMediumHighIndependent valuation, conservative entry pricing, margin-of-safety disciplineValuation committee; every transaction at entry, portfolio-wide quarterly
ConcentrationOverexposure to a single institution, sector, country or vintageMediumHighDefined exposure limits; diversification mandate across institutions, sectors, geographies and vintagesInvestment committee; quarterly portfolio review
Political and sovereignPolicy shifts, expropriation, currency controls or civil unrest affecting underlying assetsMediumMediumGeographic diversification, political risk insurance where appropriate, DFI co-investment and relationshipsInvestment committee; ongoing, formal review at each new-country entry
CurrencyLocal-currency asset values and cash flows fluctuate against the Fund's reporting and investor currenciesHighMediumNatural hedging across a diversified portfolio, selective hedging instruments, hard-currency structuring where feasibleFinance function; monthly currency exposure reporting
Governance (portfolio level)Portfolio companies inherit weak controls, related-party practices or founder-dependent decision-makingMediumHighActive board representation, upgraded controls, independent oversight introduced at acquisitionESG committee and portfolio operating team; reviewed at each board meeting
Restructuring and executionTurnarounds underperform plan, or take longer than the capital and team allottedMediumHighExperienced turnaround teams, staged capital deployment, milestone-gated follow-on investmentInvestment committee; review at each staged deployment decision
LiquidityFund or investors require cash before assets can be responsibly realisedLowMediumPermanent capital structure removes forced-exit pressure; cash reserves and disciplined liquidity managementFinance function; quarterly liquidity and reserve reporting
Regulatory and complianceFund or portfolio companies fall out of step with evolving securities, exchange-control or sector-specific regulation across multiple jurisdictionsMediumMediumLocal legal counsel in each jurisdiction, a dedicated compliance function, FSCA-regulated manager statusCompliance function; ongoing, formal review annually and at each new-jurisdiction entry
Impact and mission driftCommercial pressure erodes the development and impact objectives underlying an investmentLowHighImpact indicators set at acquisition, development covenants carried into new ownership, recognised impact-measurement frameworksESG committee; reported to investors on a regular cycle alongside financial performance
Key-person and managerPerformance depends disproportionately on a small number of individuals at the managerLowHighCommittee-based investment decisions rather than a single decision-maker, succession planning, independent director oversightBoard; reviewed at least annually
Climate and environmentalPhysical or transition climate risk affects portfolio company operations or asset valueLowMediumEnvironmental screening at diligence, climate considerations integrated into ESG monitoring, sector diversificationESG committee; ongoing, formal review annually

Escalation follows a simple rule: any risk that moves from its assessed rating toward the Fund's defined limits is escalated from the first line to the second line automatically, and any breach of a hard limit - a concentration cap, a currency exposure ceiling, a valuation policy exception - triggers immediate investment committee review rather than waiting for the next scheduled reporting cycle. The Fund's overall portfolio is stress-tested at least annually against scenarios drawn from Parts I and II of this paper - a sharper-than-expected slowdown in African growth, a sustained currency shock across several core markets, and a materially wider or narrower financing gap than the AfDB's own base case - to test whether the mitigants set out above hold under conditions more adverse than the base case this paper otherwise assumes.

F. Glossary

DFI
Development finance institution - a bilateral or national institution that provides capital, typically debt and equity, to private-sector projects in developing markets on terms commercial capital will not offer.
MDB
Multilateral development bank - a development finance institution owned by multiple sovereign governments, such as the African Development Bank or the World Bank Group.
NPL
Non-performing loan - debt on which contractual payments have lapsed or are materially impaired.
Blended finance
The strategic use of concessional development capital to mobilise additional private-sector investment into a transaction or fund.
Permanent capital vehicle
An investment vehicle with no fixed life, able to hold assets indefinitely and reinvest realised proceeds rather than distribute them on a fixed schedule.
IRR
Internal rate of return - the annualised return of an investment accounting for the timing and size of all cash flows.
Continuation vehicle
A new fund vehicle created by a private equity manager to hold one or more assets beyond the life of the original fund, typically offering existing investors the choice of cash liquidity or rolling into the new vehicle.
AfCFTA
African Continental Free Trade Area - a fifty-four-member trade agreement aiming to create a single African market.

Important information

This document has been prepared by Shiloh Capital and is provided solely for information and discussion purposes. It is strictly confidential and intended only for the institutional recipient to whom it is delivered. It may not be reproduced or redistributed, in whole or in part, without the prior written consent of Shiloh Capital.

Nothing in this document constitutes investment, legal, tax or accounting advice, an offer or solicitation to buy or sell any security or investment product, or a recommendation in respect of any investment programme or service. Any such offer would be made only pursuant to definitive documentation, the terms of which would govern in their entirety.

The concept described in this document is preliminary and indicative. Figures, structures and scenarios are illustrative, are subject to change, and require detailed institution-specific analysis and confirmation. Statements regarding the size of the opportunity, value creation and returns are estimates and forecasts only; forecasts are not a reliable indicator of future performance, and past performance is not a guarantee of future results. Figures concerning third-party institutions, markets and precedent transactions are drawn from public sources cited throughout this document and have not been independently verified by Shiloh Capital.

Shiloh Capital is a juristic representative of FyreFem Fund Managers (FSP No. 49359). Regulatory status in respect of any specific vehicle would be confirmed as part of fund formation. While the information herein has been prepared in good faith, no representation or warranty, express or implied, is made as to its accuracy, completeness or reliability, and Shiloh Capital accepts no liability for any loss arising from reliance on it.

© Shiloh Capital 2026. All rights reserved.

↑
THE CAPITAL IS THERE — Shiloh Capital
African Alternative Investment Management · August 2026

The Capital Is There

Africa's Decade Ahead

Strictly confidential — prepared for African development finance institutions, multilateral banks and development partners.
To the credit officers, restructuring teams and portfolio managers across Africa's development finance institutions — who took the risk when no one else would, and are still, ledger after ledger, waiting for someone to finish what they started.

This paper draws on Shiloh Capital's own experience originating, restructuring and stewarding African assets since 2015, together with public data and research from the African Development Bank, the International Monetary Fund, the World Bank Group, the International Finance Corporation, the U.S. International Development Finance Corporation, British International Investment, Proparco, DEG, Afreximbank, GSMA, AVCA, Convergence Blended Finance, the OECD and the Mo Ibrahim Foundation, among others cited throughout. Every figure carries its source; where reliable public data does not exist, we say so rather than guess at it.

Thank you to the portfolio managers, credit committees and chief investment officers across the continent's development institutions who, over many years of conversation, described the shape of this problem long before we had a name for it. Any errors of fact or judgment that remain are ours alone.

Shiloh Capital · Office 212, Max Office Park, 145 Second Street, Parkmore, Sandton, Johannesburg · Updated August 2026


You can see the future first in a restructuring committee.

Not in a pitch deck, and not in a press release — in the quiet, unglamorous meeting where a development finance institution decides what to do with a loan that has been renegotiated twice, an equity stake it has held four years past its intended exit, or a minority position in a company that is, by any honest measure, doing fine, but no longer fits anybody's strategy.

These meetings happen every week, in Abidjan and Nairobi, in Pretoria and Cairo, in the credit committees of institutions whose names rarely make the news. Over the past decade the substance of these meetings has not really changed. What has changed is the size of the pile.

African development finance institutions and their peers — the multilateral banks, the bilateral development finance institutions, the sovereign funds — have spent seventy years doing something almost no commercial investor will do: putting patient capital behind first-of-a-kind power plants, undercapitalised banks, unbuilt railways and farmers nobody else would underwrite. That mandate is the reason electricity reaches villages that a spreadsheet would never justify, and it is precisely why these institutions' balance sheets now carry a distinctive residue — loans restructured into a long twilight of partial performance, equity stakes held because no buyer has emerged, minority positions in good businesses that have simply outlived the strategy that created them. Individually, each position has a reasonable explanation. Collectively, they are a very large amount of capital that is neither compounding as a healthy investment nor available for redeployment into Africa's next decade of development priorities.

Almost nobody outside these institutions has added up what that pile actually is. Fewer still have asked what happens to Africa's investment case if it stays exactly where it is for another decade.

We think both questions have answers, and that the answers are more interesting — and more investable — than most people assume. Not because Africa's difficulties are imaginary; they are not, and we spend a full part of this paper on them. But because the continent that will hold a quarter of the world's people and workers by mid-century is currently financed through instruments that were not built for a continent at this stage of its development, and because the gap between those two facts is where the return sits.

Everyone in development finance is now talking about "mobilising private capital," "blended finance," and "balance-sheet optimisation." Comparatively few have sat with the actual arithmetic: what Africa's growth curve looks like against the rest of the world over the next twenty-five years; what has already been committed to the continent by patient, risk-tolerant institutions; how much of that committed capital is presently stuck rather than working; and what a permanent, professionally managed owner could do with it that a conventional ten-year fund structurally cannot. Put the four together, and a specific, financeable opportunity comes into focus — one that does not require anyone to bet on Africa's story changing, only on somebody finally being positioned to act on the version of it that is already true.

Let us show you what we see.

I.Counting Africa's Numbers

By 2050 Africa will hold a quarter of the world's working-age people. Tracing the trendlines in population, growth, mobile capital and infrastructure demand, the scale of the opportunity is not a forecast — it is already underwritten by demography.

The demographic fact

Every investment case eventually rests on a demographic case, whether its authors admit it or not. Africa's is the starkest of any region on Earth, and it is not a projection built on optimistic assumptions — it is a working-age population that has already been born.

Africa's population passed 1.5 billion in 2024, roughly one in ten people alive.1 The United Nations' own projections have the continent adding a further 950 million people by mid-century — a 63% increase, at a time when several other regions are flat or shrinking — taking Africa's population to roughly 2.5 billion and its share of humanity to close to 28%.2

Figure 1. Africa's population is on a trajectory no other continent shares
2.5bn 1.25bn 0 2024 · 1.5bn 2050 (proj.) · 2.5bn 1960 1980 2000 2020 2050
Africa's population, 1950–2050 (est./proj.). By 2050 the continent is projected to hold close to 28% of the world's people, against roughly 10% today. Source: UN DESA, World Population Prospects 2024; UNECA.

The number that matters more to an investor than the headline population figure is what sits underneath it: the working-age population, 20 to 64 years old, which the UN's Economic Commission for Africa projects will grow from 883 million in 2024 to roughly 1.6 billion by 2050 — around a quarter of the entire world's working-age people.3 The ratio of working-age people to dependents is projected to reach roughly 1.7 to 1 by 2050 — the textbook signature of a demographic dividend opening, of the kind that powered East Asia's growth from the 1960s onward. One in three young people on the planet will be African by 2050.4

Figure 2. Africa's working-age population nearly doubles by 2050
0.88bn
2024
1.60bn
2050 (proj.)
Africa's working-age population (20–64), 2024 vs. 2050 (projected). Source: UN DESA / UNECA.

None of this is a reason to be starry-eyed. A demographic dividend is an opportunity, not a guarantee; it has to be financed, employed and educated, and a continent that fails to do so converts a dividend into a liability. We return to that risk directly in Part III. But it is the fixed point against which every other number in this paper should be read: whatever else is true about Africa's difficulties, the market the continent represents in 2050 is not speculative. It is a population that already exists, ageing forward on a clock nobody can slow.

Growing faster than the world it is often compared against

Set against that demography, Africa's recent growth numbers look less like a story about potential and more like a story already in progress. The African Development Bank's African Economic Outlook 2026 puts the continent's real GDP growth at 4.4% in 2025, projected at 4.2% in 2026 and 4.4% in 2027 — with twenty-two countries expected to grow above 5% in 2025 alone.5 East Africa is the standout sub-region, growing at 6.6% in 2025 and a projected 6.4% in 2027.6 The IMF's April 2026 Regional Economic Outlook for Sub-Saharan Africa corroborates the broad picture — 4.5% growth in 2025, easing modestly to 4.3% in 2026 under pressure from global commodity shocks and reduced aid flows — while still placing the region comfortably ahead of the global growth rate.7

Figure 3. Africa is growing faster than the world economy — and East Africa faster still
East Africa (fastest-growing region) Africa (continental average) World (IMF WEO reference)
6.6%
4.4%
3.3%
2025
5.9%
4.2%
3.2%
2026
6.4%
4.4%
3.3%
2027
Real GDP growth, 2025–2027 (%). Sources: AfDB, African Economic Outlook 2026; IMF, Regional Economic Outlook: Sub-Saharan Africa, April 2026 (World figure is an IMF WEO reference range).

Twelve of the world's twenty fastest-growing economies in 2026 are African, led by Ethiopia (9.2%), Guinea (8.7%), Uganda (7.5%) and Rwanda (7.2%).8 This is not a story confined to resource exporters riding a commodity cycle; it runs through services, agriculture, construction and, increasingly, digitally-enabled commerce. The combined GDP of the fifty-four African Continental Free Trade Area signatories stands at roughly $3.4 trillion.9

A continent that went straight to the phone

If population and growth establish the size of the opportunity, Africa's digital adoption curve shows how quickly the continent absorbs new financial infrastructure once it arrives — a directly relevant fact for anyone underwriting the ability of African businesses to scale.

Africa passed one billion registered mobile money accounts by the end of 2024.10 Sub-Saharan Africa alone moved $1.4 trillion through mobile money in 2025 — 66% of the entire world's mobile money transaction value — across 1.2 billion registered accounts.11 The GSMA's own framing of the trend is the most useful summary available: it took twenty years for African mobile money to reach $1 trillion in annual transaction value, and just four more years to double it.12

Figure 4. It took 20 years to reach $1 trillion in mobile money — four more to double it
$1.6T $0.8T 0 $1.4T in 2025 2021 2022 2023 2024 2025
Mobile money transaction value, Sub-Saharan Africa, 2021–2025 ($ trillion, illustrative trajectory to the disclosed 2025 total). Source: GSMA, State of the Industry Report on Mobile Money 2026.

The pattern repeats in venture and technology financing. African tech startups raised $4.1 billion in equity and debt in 2025, up 25% year-on-year, with fintech taking the largest single share of equity funding.13 The continent's unicorn count reached ten in August 2026, when Nigerian mobility-fintech Moove raised $250 million at a valuation above $2 billion, joining Interswitch, Flutterwave, OPay, Andela, Moniepoint, Wave, Chipper Cash, MNT-Halan and Tyme Group.14 None of these companies exists because Africa waited for fixed-line infrastructure to catch up with the rest of the world. They exist because the continent skipped that generation of infrastructure entirely and built its financial system on the device already in every pocket.

A market being stitched into one

The African Continental Free Trade Area — the largest free trade area by number of member states in the world — is no longer a policy aspiration. Fifty of fifty-four signatories had ratified the agreement by December 2025, twenty-five had finalised their tariff schedules, and the World Bank's own modelling of the agreement's effects, still the most-cited estimate of its impact, projects it could raise African regional income by $450 billion by 2035, lift intra-African exports by 81%, and move roughly thirty million people out of extreme poverty.15 A fragmented continent of fifty-four separate regulatory jurisdictions is, slowly and unevenly, becoming a single market of 1.3 billion consumers — precisely the kind of structural tailwind that turns a well-run regional business into a continental one.

What Africa still lacks — and who is meant to supply it

None of this happens without financing, and this is where the picture turns from tailwind to constraint. Roughly 600 million people in Sub-Saharan Africa still lack access to electricity — about 80% of the entire world's unelectrified population — and the region is projected to account for 85% of the world's remaining unelectrified people by 2030.16 Africa holds an estimated 60% of the world's best solar resources and attracts roughly 2% of global energy investment.17

The African Development Bank's current estimate is that the continent needs $130–170 billion a year in infrastructure investment; roughly $80 billion a year is currently invested; the resulting financing gap — the figure informally rounded in industry conversation to "about $100 billion a year" — sits somewhere between $50 and $90 billion annually, a shortfall AfDB itself estimates costs Africa close to two percentage points of GDP growth every year it persists.18 Layer on the AfDB's broader estimate of a $402 billion annual structural-transformation financing gap and a $242 billion annual climate financing gap through 2050, and the total financing need to meet the continent's Sustainable Development Goals exceeds $1.3 trillion.19

Figure 5. Africa's infrastructure financing gap, per the African Development Bank
$130–170bn/yr
Estimated annual investment need
$80bn/yr
Currently invested per year
$50–90bn/yr
Resulting financing gap
Africa's infrastructure financing gap, per the African Development Bank's current cited range. Source: AUDA-NEPAD / Africa-Europe Foundation (2025); AfDB.

Meanwhile the composition of external capital reaching Africa has quietly inverted. Remittances to the continent reached $90.8 billion in 2023 — 11% of the global total — now larger than official development assistance, which stood at $73.6 billion and has fallen from 37.6% of global aid flows in 2013 to 26.7% in 2023.20 Foreign direct investment, meanwhile, is the volatile leg of the stool: continental inflows fell 42% year-on-year to $28 billion in the first half of 2025 alone.21 Illicit financial outflows from the continent, estimated at $88.6 billion a year, now roughly match the entire aid budget flowing the other way.22

Figure 6. Remittances now dwarf traditional aid as Africa's external lifeline
Remittances
$90.8bn
Illicit financial outflows
$88.6bn
Official development aid
$73.6bn
Climate finance received
$36.1bn
External capital flows into Africa, 2023 ($bn). Source: Mo Ibrahim Foundation, "Facts & Figures, May 2025"; figures reflect differing methodologies across categories and should be read as orders of magnitude rather than a single reconciled ledger.

Read plainly, these numbers say something uncomfortable and something hopeful in the same breath. Uncomfortable, because aid — the traditional mechanism through which the world has financed African development — is shrinking in real terms and shrinking as a share of what the continent actually needs. Hopeful, because private commerce, remittances and mobile-enabled capital have already, on their own, outgrown it. The animating idea of this paper follows directly from that shift: the paper's job is not to argue that Africa needs more aid. It is to argue that a very large amount of patient, risk-tolerant capital has already been committed to the continent by exactly the institutions built to provide it — and that the binding constraint today is not the size of that commitment. It is what has happened to it since.

That is the subject of Part II.

Notes — Part I

  1. UNECA, "As Africa's Population Crosses 1.5 Billion, the Demographic Window Is Opening," 2024, citing UN DESA, World Population Prospects 2024. ↩
  2. UN DESA, World Population Prospects 2024; UNECA, ibid. Global population is projected to reach ~9.8 billion by 2050 (UN DESA, World Population Prospects 2024: Summary of Results). ↩
  3. UNECA, "As Africa's Population Crosses 1.5 Billion," 2024, citing UN DESA WPP 2024. ↩
  4. UNECA, ibid. ↩
  5. AfDB, "Africa's Growth Holds Firm Amid Global Turbulence, Says 2026 African Economic Outlook," May 2026. ↩
  6. AfDB, ibid. ↩
  7. IMF, Regional Economic Outlook: Sub-Saharan Africa, "Hard-Won Gains Under Pressure," April 2026. ↩
  8. Afridigest, "The 10 Fastest-Growing Economies in Africa in 2026," citing IMF World Economic Outlook, April 2026. ↩
  9. U.S. Department of Commerce, Trade.gov, "Ghana: African Continental Free Trade Area (AfCFTA) — December 2025 Update." ↩
  10. GSMA data via AllAfrica, "Africa Surpasses 1bn Mobile Money Wallets With $1tn Traded in 2024," April 2025. ↩
  11. GSMA, State of the Industry Report on Mobile Money 2026, March 2026, via Connecting Africa. ↩
  12. GSMA, ibid. ↩
  13. Partech, "2025 Africa Tech VC Report," January 2026. ↩
  14. BusinessDay NG, "Africa's Unicorn Club Grows to 10, Nigeria Remains Continent's Dominant Hub," August 2026. ↩
  15. World Bank, The African Continental Free Trade Area: Economic and Distributional Effects, July 2020, via tralac; Trade.gov, "Ghana: AfCFTA — December 2025 Update." ↩
  16. International Energy Agency, SDG7: Data and Projections — Access to Electricity, 2024. ↩
  17. European Commission estimate, cited via Nairametrics, November 2025; IRENA, Renewable Capacity Statistics 2025/2026. ↩
  18. AUDA-NEPAD / Africa-Europe Foundation, "The Missing Connection: Unlocking Sustainable Infrastructure Financing in Africa," 2025; AfDB, cited via UNECA, November 2023. ↩
  19. AfDB, "Current Challenges," 2025 Annual Meetings, citing African Economic Outlook 2024. ↩
  20. Mo Ibrahim Foundation, "Facts & Figures, May 2025 — Financing The Africa We Want." Sub-Saharan-Africa-only remittance figures from the World Bank ($54–56bn, 2023–25) reflect a narrower geographic scope than the continent-wide figure used here. ↩
  21. UNCTAD, Global Investment Trends Monitor, October 2025, via Ecofin Agency. ↩
  22. Mo Ibrahim Foundation, ibid. ↩

II.From Trapped Value to Governed Equity

Development finance institutions already hold the patient capital Africa needs — tens of billions of dollars of it, much of it immobilised on their own balance sheets. Debt-to-equity conversion, held inside a permanent capital structure, is the engine that turns impaired claims into compounding ownership.

The residue on the balance sheet

Development finance institutions exist to take risk that commercial capital will not. They lend to first-of-a-kind projects, capitalise companies in frontier markets, and hold equity through cycles that would deter a conventional fund. That mandate is essential, and it is precisely why their balance sheets accumulate a distinctive set of positions over time. Some loans are restructured once, then again, and settle into a long twilight of partial performance. Some equity stakes, taken to catalyse a business, remain in place a decade later because no natural buyer has emerged. Some minority positions sit in companies performing well but no longer aligned with a sponsor's evolving country or sector strategy.

Individually, each of these positions has a rationale for remaining where it is. Collectively, they represent a significant store of value that is neither generating the returns of a healthy investment nor available for redeployment into the next generation of development priorities. The capital is committed. It is not free.

Table 1. Indicative taxonomy of trapped development-balance-sheet positions.
CategoryNature of the positionWhy it is trapped
Non-performing loansDebt where contractual payments have lapsed or are materially impairedProvisioned but unresolved; consumes capital and management time
Distressed & restructured debtExposures restructured one or more times, performing partiallyNo clear path to full recovery; uncertain residual value
Over-held equityEquity stakes retained well beyond the intended exit horizonNo natural buyer; listing routes shallow or closed
High-quality minority stakesMinority positions in fundamentally sound businessesIlliquid; limited control; outside current strategic priorities
Legacy & orphaned assetsPositions from prior strategies, funds or merged entitiesSub-scale, non-core, requiring bespoke management

The constraint is structural rather than a reflection of asset quality. African secondary markets for private positions are thin. Strategic buyers willing and able to acquire a DFI's stake at fair value are scarce. Public equity markets across much of the continent are shallow and episodic, making initial public offerings an unreliable exit route. This is not a claim requiring much imagination to verify: the JSE alone carries a market capitalisation of roughly $1.48 trillion, dwarfing the Nigerian Exchange's roughly $53 billion and the Nairobi Securities Exchange's roughly $31 billion combined many times over.1 Outside Johannesburg, there is, in the most literal sense, nowhere to sell most of this.

Figure 7. Outside Johannesburg, African public markets are too shallow to be an exit route
$1,480bn
JSE (South Africa)
$53bn
NGX (Nigeria)
$31bn
NSE (Kenya)
Market capitalisation of major African stock exchanges (bars scaled for legibility; the underlying data spans two orders of magnitude — see Figure 7 note in the original). Sources: JSE Limited (Jan. 2026); NGX Group via Nairametrics (Jan. 2026); Nairobi Securities Exchange via Kenyan Wall Street (2026).

The result is that holding periods stretch far beyond original intentions, and the management attention required to steward these positions competes directly with each institution's forward-looking mandate. Across African private equity broadly — not development finance alone, but the closest market-wide proxy available — the average holding period now runs 6.4 years, and the share of exits completed within five years has fallen from 33% in the early 2000s to just 12% today.2 Only 32% of African private equity exits between 2000 and 2023 were secondary sales to another financial sponsor, against 45% globally — a structural gap in the exit routes that exist everywhere else.3 The exit window on the continent is not opening. It is closing.

Figure 8. The African exit window is closing, not opening
33%
Early 2000s
12%
Recent years
Share of African private equity exits completed within five years. Source: AVCA data via ImpactAlpha.

This is not a hypothetical market — a version of it already exists

The instinct to doubt that a market this specific could really be under-served is a reasonable one, so it is worth being precise about what already exists and what does not.

The single closest precedent is IFC's own Distressed Asset Recovery Program, launched in 2007 to acquire and resolve non-performing loans, initially in Latin America. It has since expanded to the Caribbean (2009), Europe (2010), Asia (2014) and — only in 2020 — Sub-Saharan Africa. Across all regions it has committed a cumulative $10.2 billion (a $3.4 billion own-account commitment mobilising a further $6.7 billion in third-party capital), addressing more than $49 billion in unpaid principal across 330-plus acquired portfolios.4 Africa currently represents roughly 6% of the programme's total activity — the newest and smallest region it operates in.5 This is, in effect, the world's own development finance system telling us two things at once: the model of acquiring and resolving distressed development-linked exposures works well enough that the IFC has run it globally for close to two decades — and Africa is where it is least built out.

Figure 9. IFC's Distressed Asset Recovery Program: geographic expansion, 2007–2020
2007
Latin America
2009
Caribbean
2010
Europe
2014
Asia
2020
Sub-Saharan Africa
Africa is the programme's newest region and, at roughly 6% of cumulative activity, its smallest. Source: IFC, "Distressed Asset Recovery Program Overview," 2024.

A second, cautionary precedent sits closer to home. Nigeria's Asset Management Corporation (AMCON) was established in 2010 to absorb non-performing loans following the country's 2009 banking crisis, acquiring assets with a face value of ₦1.7 trillion at inception. Fifteen years later, more than ₦1 trillion of eligible bank assets remain outstanding and unresolved.6 AMCON demonstrates that the underlying problem — impaired development-linked and bank credit needing a dedicated, disciplined resolution vehicle — is real and large. It also demonstrates the risk of getting the vehicle's structure wrong: a state-directed, politically entangled bad bank without a hard governance mandate and a genuinely private, professional operating discipline can extend a workout indefinitely rather than resolve it.

India offers a more encouraging structural template. The National Asset Reconstruction Company Limited, launched in 2021 to acquire large stressed-loan accounts, pays selling banks 15% cash and 85% government-guaranteed security receipts — a partial-cash, partial-deferred-consideration structure directly relevant to how a fund might price the acquisition of a DFI's legacy book. Against a five-year target of ₹200,000 crore in acquisitions, NARCL had reached ₹165,862 crore across thirty-three borrower entities by March 2026 — a slow start followed by a substantial catch-up, resolved through a dedicated servicing entity that runs the workouts via competitive, professional bidding rather than in-house.7

No global precedent exists, so far as we have been able to establish, for a permanent-capital vehicle purpose-built to acquire distressed debt and over-held equity directly from development finance institutions and multilateral banks, in Africa or anywhere else. That is the honest way to characterise the opportunity: the individual components — distressed-asset acquisition, debt-to-equity conversion, permanent-capital ownership — are each separately proven at scale. Their combination, aimed specifically at the DFI balance sheet, is not something anyone else is presently doing.

The mechanics of conversion

Where the underlying business is fundamentally viable, acquisition is the beginning of the value-creation process rather than the end of it. The fund restructures the capital structure to a sustainable level and converts debt to equity where doing so creates more value than continued lending. A creditor with an impaired claim becomes a shareholder with governance rights, board representation and a direct stake in the recovery. Recapitalisation transactions follow, strategic partners and co-investors are introduced, and an operational turnaround proceeds under experienced management — the company becoming, at that point, a long-term portfolio holding rather than a workout file.

1
Acquisition

Distressed or nonperforming debt acquired at a discount to realistic recovery value, not face value and not fire-sale price.

→
2
Restructuring

Capital structure right-sized; debt converted to equity where that creates more value than continued lending.

→
3
Turnaround

Fresh capital, strategic partners and experienced operators drive operational improvement and growth.

→
4
Compounding

Long-term equity ownership inside a permanent structure, held to realise full enterprise value creation over years, not quarters.

Figure 10. The value bridge from impaired claim to compounding equity ownership.

Why does the conversion itself create value, rather than simply changing who holds the same risk? Because it right-sizes the balance sheet so the business can invest and grow rather than service unsustainable debt; because it aligns the holder's incentives with the long-term health of the enterprise rather than near-term cash extraction; because it converts a capped, deteriorating claim into an uncapped equity participation in the recovery; and because it brings active governance to a company that, as a distressed borrower, was very often under-supervised. This is not a novel insight invented for African assets — it is the standard playbook of distressed-for-control investing, applied with unusual discipline to a market where impaired debt, viable underlying businesses and a genuine scarcity of patient capital coincide more starkly than almost anywhere else.

The academic evidence for the underlying mechanism is close to as good as corporate-finance research gets. A study of 2,156 leveraged-loan borrowers between 1997 and 2010, including 991 private-equity-backed firms, found that PE-backed distressed companies restructure 36% faster than comparable non-PE-backed firms, resolve 52% of defaults out-of-court or via pre-negotiated bankruptcy (against 36% for non-PE firms), and are 8% more likely to survive as a going concern. Private equity owners retained control in 18% of restructurings, versus just 4% for non-PE owners — direct evidence that control investors are disproportionately the ones who convert debt into equity through restructuring, and that doing so measurably improves outcomes for the underlying business.8

Why permanence compounds

Our favorite holding period is forever.Warren Buffett — Berkshire Hathaway, Chairman's Letter to Shareholders, 1988

The case for converting distressed debt into equity is only half the argument. The other half is what structure should hold the resulting equity — and here the evidence is unusually direct, because a small number of permanent-capital vehicles have spent decades publishing exactly the numbers this question turns on.

Berkshire Hathaway's per-share market value has compounded at 19.9% annually since 1965, against 10.4% for the S&P 500 with dividends reinvested — a gap sustained across sixty years.9 Sweden's Investor AB, the Wallenberg family's holding company, has returned 17% annually over both the past ten and twenty years, against 11% for its benchmark index.10 Exor, the Agnelli family's vehicle, has compounded net asset value per share at 18.0% since its 2009 Euronext Milan listing, against 12.0% for the MSCI World.11 Fairfax Financial's book value per share has compounded at 18.7% annually, including dividends, since 1985.12

Figure 11. Permanence compounds: long-run returns of four permanent-capital vehicles
Permanent-capital vehicle Public market benchmark
19.9%
10.4%
Berkshire Hathaway
(1965–2024)
17.0%
11.0%
Investor AB
(2004–2024)
18.0%
12.0%
Exor
(2009–2024)
18.7%
Fairfax Financial
(1985–2024)
Long-run compound annual returns of four permanent-capital vehicles against their disclosed benchmarks. Sources: company annual reports and shareholder letters, as cited.

These vehicles have almost nothing in common sector-wise — insurance and railroads, Nordic industrials, European luxury and automotive holdings, insurance and reinsurance again. What they share is structural: no fixed fund life, no obligation to distribute realised gains rather than reinvest them, and a governing board answerable to permanent shareholders rather than to a partnership agreement with a maturity date. The mechanism is not mysterious. It is the simple, compounding arithmetic of never being forced to sell a good asset on somebody else's calendar.

The scale of that "somebody else's calendar" problem, globally, is larger than most limited partners appreciate. Bain & Company's 2026 Global Private Equity Report counts 32,000 unsold portfolio companies worldwide, worth $3.8 trillion, currently held by private equity funds beyond their intended exit — up from 29,000 companies worth $3.6 trillion the year before.13 Average buyout holding periods at exit have stretched to roughly seven years, up from five to six years across 2010–2021, and distributions to limited partners fell to just 14% of net asset value in 2025 — the lowest level since the 2008–09 financial crisis.14 The industry's own response has been telling: continuation-vehicle transaction volume reached roughly $63 billion in 2024, nearly tripling in five years, precisely because general partners need a mechanism to keep holding good assets rather than sell them into a depressed market on a fixed clock.15 When offered the option, roughly 90% of limited partners elect to take the liquidity a continuation vehicle provides rather than remain locked into the old fund16 — an industry-wide referendum, in effect, on how much investors value permanence once someone finally offers it to them. Global private markets are quietly re-engineering their way toward permanent capital because the alternative is proving too costly. This paper proposes building that way from the outset, for a market where the mismatch between asset duration and fund duration is more severe than almost anywhere else.

Figure 12. Held past their intended exit: the global buyout backlog, 2022–2025
27k
2022
28k
2023
29k
2024
32k
2025
Unsold, PE-owned portfolio companies held globally past their intended exit, 2022–2025 (illustrative build-up to the disclosed 2025 total of 32,000 companies worth $3.8 trillion). Source: Bain & Company, Global Private Equity Report 2026.

What distressed-to-equity investing actually returns

The return profile of distressed-for-control investing is real but genuinely dispersed, and a credible paper should show the dispersion rather than the best year. Preqin's benchmark data across distressed private equity fund vintages from 1999 to 2008 shows a pooled median net IRR of 14.4%, with a standard deviation of 17.5 percentage points — the widest dispersion of any private equity strategy Preqin tracks. The best individual vintage, 2002, posted a median net IRR of 26.4%, precisely because it was deployed into the aftermath of the early-2000s credit cycle; the weakest vintages, deployed at less favourable points in the cycle, returned closer to 8%.17 Distressed strategies deployed into genuine dislocation — the Global Financial Crisis vintages among them — have historically outperformed buyout and growth strategies of the same vintage year.18

Figure 13. Distressed-to-equity investing: return dispersion by vintage
11.5
1999
13.0
2000
15.5
2001
26.4
2002
18.0
2003
12.5
2004
9.5
2005
8.0
2006
14.5
2007
14.4
2008
Distressed private equity, median net IRR (%) by fund vintage year — pooled median across the period: 14.4%. Source: Preqin, Special Report: Distressed Private Equity.

The lesson from that dispersion is not that distressed investing is unreliable — it is that entry discipline and vintage timing matter enormously, which is exactly why this paper does not propose raising a single closed-end fund to deploy into whatever the market offers over a fixed investment period. It proposes a permanent platform that can acquire opportunistically, across cycles, at the pace the market actually presents them, and hold the resulting equity for as long as the underlying business needs to compound — a structure built to capture the upper end of that return distribution rather than be a hostage to whichever vintage year it happens to be born in.

African private equity's own aggregate return history, where it is public at all, is thinner and more dated than one would like: a Cambridge Associates / AVCA benchmark of forty institutional-quality funds showed an 11.2% annualised ten-year return as of September 2012; the same benchmark series showed pooled ten-year net returns of just 5.47% by around 2016.19 AVCA's more recent flagship activity reports track fundraising, deal and exit volumes in detail but no longer publish comparable IRR benchmarks, and no African-focused manager we are aware of — including well-regarded names such as Helios Investment Partners, AfricInvest, Development Partners International and Vantage Capital — discloses fund-level return figures publicly.20 We record this candidly rather than paper over it: African private capital performance data is genuinely opaque, which is itself part of the opportunity this paper describes — a disciplined, permanent, professionally governed platform that reports transparently would be filling a gap the market has not yet filled for itself.

The economics, in other words, are not the hard part. The hard part — and the honest one — is everything covered in Part III.

Notes — Part II

  1. JSE Limited market data, January 2026; Nairametrics, "NGX Group Steers Nigerian Capital Market to World-Beating 51.19% Rally in 2025," January 2026; Kenyan Wall Street / Rio Times Online, "Nairobi Securities Exchange Crosses KSh 4 Trillion," 2026. ↩
  2. AVCA data via ImpactAlpha, "To Unclog Private Equity Funding, Africa Needs to Develop a Market for Secondaries," 2025/2026. ↩
  3. ImpactAlpha, ibid. ↩
  4. IFC, "Distressed Asset Recovery Program Overview," 2024. ↩
  5. IFC, ibid. ↩
  6. AMCON, official corporate disclosures, 2026. ↩
  7. IMPRI India, "Assessing the Progress of NARCL in India," 2025; NARCL, official disclosures. ↩
  8. Hotchkiss, Smith & Strömberg, "Private Equity and the Resolution of Financial Distress," 2012. ↩
  9. Berkshire Hathaway, 2024 Annual Report / Chairman's Letter. ↩
  10. Investor AB, 2024 Annual Report. ↩
  11. Exor, 2024 Annual Report. ↩
  12. Fairfax Financial, 2024 Shareholders' Letter. ↩
  13. Bain & Company, Global Private Equity Report 2026. ↩
  14. Bain & Company, ibid. ↩
  15. Jefferies (2025) data, cited in CFA Institute Research and Policy Center, "Continuation Funds: Ethics in Private Markets, Part I." ↩
  16. Houlihan Lokey, 2024 Continuation Fund Study, May 2025. ↩
  17. Preqin, Special Report: Distressed Private Equity. ↩
  18. Preqin, ibid. ↩
  19. Cambridge Associates / AVCA Africa Private Equity and Venture Capital Index, April 2013 and April 2017 releases. ↩
  20. AVCA, African Private Capital Activity Report 2024; manager websites, reviewed 2026. ↩

III.The Challenges

None of this is easy, and pretending otherwise would not survive a single credit committee. The exit gap, the governance burden, the case for a platform rather than a fund, and why this decade — not the next one — is the one that matters.

It would be easy to stop at Part II. The demographic case is real, the trapped-value thesis is real, and the return precedents for both permanent capital and distressed-to-equity investing are well documented. But an investor who has sat through even one African credit committee knows that a compelling thesis and an investable structure are different things. This part addresses the four questions that determine whether they are the same thing here: the right time horizon, the discipline that controls the downside, the right organisational form, and the reason timing matters as much as structure.

IIIa.Why ten years is the wrong horizon

African development assets, particularly those that have been distressed, restructured or held through difficult cycles, do not conform to a ten-year clock. Turnarounds take time. Recapitalised businesses need years, not quarters, to rebuild. Infrastructure and agribusiness assets generate their returns over long horizons. A conventional closed-end private equity fund, with its fixed life and its obligation to return capital by a set date, is fundamentally misaligned with these realities.

The misalignment is not merely inconvenient — it destroys value. A fund approaching the end of its life becomes a forced seller, exiting assets when its calendar dictates rather than when value is maximised. This dynamic transfers value from the fund to the buyer, and pressures managers toward financial engineering over patient operational improvement. For assets where the realisation of value and impact is inherently long-dated, the cost of an artificial deadline is especially high — and, as Part II showed, the industry's own scramble toward continuation vehicles is a $63-billion-a-year admission that the conventional model breaks down in exactly this way, globally, even in developed markets with deep secondary buyer pools. In Africa, where secondary buyer pools are thinner still, the same forced-exit dynamic is worse, not better.

Table 2. Comparison of long-term ownership structures against the requirements of the strategy.
StructureCapital permanenceExit pressureFit for purpose
Traditional private equity fundFixed ten-year lifeHigh; forced exits at maturityPoor for long-dated development assets
Evergreen fundRolling, with redemption windowsModerate; liquidity demands persistBetter, but redemption risk remains
Permanent capital vehiclePerpetualLow; exits are discretionaryStrong alignment with the strategy
Listed investment companyPerpetual; market liquidityLow; shares trade, assets heldStrong; permanence plus investor liquidity
Holding companyPerpetualLowStrong; flexible long-term ownership

We recommend a permanent capital vehicle organised around a holding company at the apex, with the option of a public listing as the platform matures — a dual-vehicle approach that combines the permanence of perpetual capital with a route to liquidity for investors who require it. The holding company owns the portfolio of converted, acquired and consolidated assets and reinvests realised proceeds rather than distributing them on a fixed schedule, allowing value to compound. Limited partners and cornerstone investors hold interests in the vehicle, and over time a listing can provide tradeable exposure without forcing the sale of underlying assets. It is the model Berkshire Hathaway, Investor AB, Exor and Fairfax Financial have each used, in their own markets, to build the durable, compounding franchises documented in Part II — adapted here to the specific needs of African development assets.

IIIb.Locking down the downside

Acquiring and restructuring development assets carries real risks, which the Fund is designed to manage deliberately rather than assume away.

Table 3. Principal risks and corresponding mitigants.
RiskMitigation
Asset valuationIndependent valuation, conservative entry pricing and margin of safety; valuation committee oversight
ConcentrationDiversification across many institutions, sectors, geographies and vintages; defined exposure limits
PoliticalGeographic diversification, political risk insurance where appropriate, and partnership with DFIs
CurrencyNatural hedging across the portfolio, selective hedging instruments and hard-currency alignment where feasible
GovernanceActive board representation, upgraded controls and independent oversight at portfolio level
RestructuringExperienced turnaround teams, staged capital deployment and clear value-creation milestones
LiquidityPermanent capital structure removes forced exits; reserves and disciplined cash management maintained

The permanent capital structure itself deserves particular emphasis as a risk mitigant, not merely a return enhancer. By removing the obligation to exit on a fixed timetable and reducing reliance on refinancing windows, it eliminates two of the most common sources of value destruction in conventional funds. The Fund can hold through volatility, support portfolio companies through difficult periods, and transact when conditions are favourable rather than when a calendar demands it.

Governance is designed to meet the standards development finance institutions and multilateral investors expect as a baseline, not as a concession. Shiloh Capital acts as general partner and manager, accountable for investment decisions and portfolio performance within defined mandates; DFIs and other investors hold limited partner interests with defined rights, including representation on an advisory board; an investment committee approves all acquisitions, restructurings and material transactions against the Fund's mandate and risk limits; a valuation committee oversees independent, consistent valuation using recognised methodologies; an ESG committee oversees impact measurement and the preservation of development objectives; and independent directors bring outside judgement to the holding company board and its key committees. Institutional-grade financial and impact reporting is provided on a regular cycle, aligned to recognised standards.

Impact is preserved by the same discipline, not bolted on afterward. Every portfolio company is assessed against a tailored set of impact indicators at acquisition — covering employment, production, access, governance and environmental performance — measured against a baseline and reported to investors on a regular cycle, using recognised impact-measurement frameworks. The Fund's activities are mapped against the Sustainable Development Goals its underlying sectors touch most directly: zero hunger (agribusiness turnaround and growth capital), good health and well-being (preserving healthcare and pharmaceutical capacity), quality education (skills, training and education-linked enterprises), gender equality (gender-inclusive governance and employment practice), affordable and clean energy (stewarding energy and electrification assets), decent work and economic growth (preserving and creating jobs through enterprise continuity), industry, innovation and infrastructure (recapitalising manufacturing, beneficiation and infrastructure assets), responsible consumption and production, and climate action. Development covenants are carried forward into new ownership rather than left to chance, and ESG considerations are integrated into diligence, the investment decision and ongoing monitoring — so that impact and risk are managed together rather than in isolation.

IIIc.The platform, not the fund

The proposition set out in this paper is easy to mistake for a one-time transaction — a fund that buys a defined book of distressed assets, works through it, and closes. That would be a misreading of both the opportunity and the structure required to capture it.

Development institutions hold portfolios numbering in the hundreds of positions each, and they continually originate new exposures that will, in time, require management or exit. A vehicle that earns a reputation as a fair, professional and impact-aligned counterparty becomes the natural first call for the next transaction, and the one after that. Each successful transaction builds the relationships, the proprietary knowledge of specific institutions' portfolios, and the institutional trust that make the next transaction easier to originate and better to price. This is precisely the mechanism visible in IFC's own Distressed Asset Recovery Program, discussed in Part II: a programme that began in one region in 2007 has spent eighteen years compounding relationships and expertise into a $10.2 billion cumulative platform spanning five regions. The proposition here is the African-specific, DFI-focused equivalent — aimed from inception at the region where that model is least built out.

Structured this way, the Fund aims to occupy four defining positions in the market simultaneously: the preferred buyer of DFI assets, the preferred restructuring partner for distressed development exposures, the preferred turnaround investor for viable but troubled businesses, and the long-term owner of strategically important African enterprises. Each role reinforces the others, and together they create a durable competitive position — a flywheel in which transactions build trust and data, trust and data improve access and pricing, and better access and pricing generate more transactions. Over time, the platform aggregates a diversified, continental portfolio of development assets that no single fund vintage could assemble on its own, with an information and relationship advantage that is difficult for a new entrant to replicate quickly.

IIId.Africa must not be left waiting

Everything in this paper works on a timetable, and the timetable is not generous. Part I established that Africa's growth curve, its digital adoption and its demographic dividend are not forecasts requiring anyone's faith — they are already in motion. That is precisely why the next few years matter more than the ones after them. A working-age population does not wait for financing architecture to catch up with it; it either finds productive employment during its dividend window, or the window narrows as the same population ages without having been financed into productivity. Africa's median age is roughly 19 years against roughly 43 in Europe1 — a gap this stark closes only once, and only if the capital is in place while it is open.

The same urgency applies to the balance-sheet problem this paper is centred on. Every year that trapped value remains trapped is a year of foregone compounding, a year of management attention diverted from new development priorities, and a year in which the institutions holding these positions carry them at a cost — in provisions, in capital charges, in opportunity — that a professional, permanent owner would not. The AfDB's own $50–90 billion annual infrastructure financing gap, set out in Part I, will not close through aid, which is shrinking, nor through foreign direct investment, which is volatile and itself fell 42% in the first half of 2025 alone.2 It closes, if it closes at all, through the private mobilisation of capital that is already committed to the continent but presently immobilised — precisely the capital this paper is about.

There is also a plainer, more competitive way to state the same point. The individual components of this strategy — distressed-asset acquisition, debt-to-equity conversion, permanent capital — are proven, well-understood tools that global capital already uses everywhere else. Applying them systematically to African development assets is, at the time of writing, something nobody else is doing at scale. That is a genuine first-mover position, and first-mover positions in finance do not stay open indefinitely. IFC needed thirteen years to expand its own distressed-asset programme from Latin America to Sub-Saharan Africa. The institution, the relationships and the platform that establish themselves as the preferred counterparty for this specific market over the next several years are likely to hold that position for a long time afterward — and the institution that waits for someone else to prove the model first will be negotiating as the second call, not the first.

None of this requires anyone to bet on Africa's story changing. It requires someone to be positioned to act on the version of it that is already true — which is the subject of Part IV.

Notes — Part III

  1. Figure widely corroborated across secondary sources citing UN World Population Prospects data; treated here as indicative of the scale of the gap rather than a single precise UN-published statistic. ↩
  2. UNCTAD, Global Investment Trends Monitor, October 2025. ↩

IV.The Fund

A concrete proposal: the African Development Assets Permanent Capital Fund, Shiloh Capital's role as sponsor, manager and development partner, four routes for a founding institution to participate, and the sizing of the opportunity in dollars and years.

Everything in Parts I through III is analysis. This part is the proposal: the African Development Assets Permanent Capital Fund, a permanent capital investment vehicle established to acquire, restructure, consolidate and actively manage assets currently trapped on the balance sheets of African development finance institutions and their peers — designed as a repeatable, scalable exit and restructuring solution that releases capital for redeployment while preserving and extending developmental impact.

An integrated mandate

Shiloh Capital was founded in 2015 on a simple conviction: that the patient, disciplined ownership of African productive assets is among the most consequential forms of capital allocation available anywhere in the world. We propose to fulfil four distinct but connected roles in relation to the Fund, giving development finance institutions a single accountable partner across the full life of each transaction.

As strategic advisor, Shiloh Capital works with institutions to identify candidate assets, conduct portfolio reviews, design restructuring approaches and provide transaction advisory through to completion — ensuring transactions are well-structured and fairly priced from the outset. As fund sponsor, Shiloh Capital leads the formation of the Fund, manages investor relations, raises capital from limited partners and cornerstone investors, and designs the governance architecture that protects all stakeholders. As fund manager, Shiloh Capital is responsible for investment management, portfolio monitoring, value creation through operational engagement, risk management across the portfolio, and the management of eventual exits where they serve investors' interests. And as development partner, Shiloh Capital owns impact measurement and ESG implementation, ensuring the development thesis is delivered and evidenced throughout the holding period.

Four routes to participation

Institutions differ in their constraints and objectives, and the Fund is designed to meet them where they are. Four seed structures are available, each engineered to be low in friction and to convert otherwise illiquid balance-sheet value into a governed interest in a diversified platform.

Table 4. Seed investment structures available to founding institutions.
RouteMechanismPrincipal benefit to the institution
A — Asset-for-LPAsset contribution in exchange for limited partner interestsConverts illiquid positions into a diversified LP stake without cash outlay
B — Cash plus assetCash commitment combined with an in-kind asset contributionCombines fresh capital with in-kind transfer for greater scale and alignment
C — Warehouse transferA defined portfolio transferred into the Fund as a warehouse, in a single transactionMoves a defined book off balance sheet in one efficient transaction
D — Anchor cornerstoneCommitment as the Fund's anchor cornerstone investorSecures founding economics and governance influence as a lead investor

Under Route A, the institution contributes eligible assets to the Fund in exchange for limited partner interests of equivalent assessed value — requiring no cash outlay, immediately diversifying the institution's exposure across the Fund's portfolio, and transferring active management to Shiloh Capital while the institution retains economic participation in the upside. Under Route B, the institution combines a cash commitment with an in-kind asset contribution, deepening alignment and accelerating the Fund's path to scale. Under Route C, a defined portfolio is transferred into the Fund as a warehouse in a single transaction — an efficient, comprehensive balance-sheet exit that simplifies the institution's reporting and gives the Fund an immediate, diversified base of assets to manage and grow. Under Route D, the institution commits as the Fund's anchor cornerstone investor, taking founding economics and a defined governance role — signalling confidence to other investors and aligning the founding institution with the platform's long-term success.

Sizing the opportunity, honestly

A precise figure for the addressable universe requires institution-by-institution analysis that only a formal portfolio review process can produce, and we are wary of the kind of false precision that undermines credibility with the audience this paper is written for. What can be said with confidence is that the scale is large and that the patient capital already exists in concentrated form.

Figure 14. The patient capital is already there — concentrated on a handful of balance sheets
AfDB Group (total capital base)
$318.0bn
Afreximbank (total assets)
$48.5bn
IFC (FY24 Africa commitments)
$14.2bn
BII (Africa portfolio)
$5.5bn
Proparco (2024 Africa signings)
$1.4bn
DEG (2024 Africa/MENA business)
$0.7bn
Scale of capital already committed to Africa by a sample of major development finance institutions. Figures are not on a uniform accounting basis — they mix total capital base, cumulative total assets, and single-year new-business or commitment volumes — and are shown here to illustrate order of magnitude, not to be summed. Sources: AfDB (total authorised capital, June 2024 General Callable Capital Increase); IFC (FY2024 Africa commitments); BII (2025 Africa portfolio, Key Data); Afreximbank (FY2025 total assets); Proparco and DEG (2024 Africa/MENA new business).

The African Development Bank Group's total authorised capital base reached $318 billion following its June 2024 general capital increase.1 IFC committed a record $14.2 billion to Africa in its 2024 fiscal year alone.2 British International Investment's Africa exposure stood at $5.5 billion, 60% of its total portfolio, across 899 African companies at the end of 2025.3 Afreximbank's total assets and contingencies reached $48.5 billion at the end of 2025.4

None of these institutions discloses, in public materials, what share of its book is impaired, restructured or held past its intended exit — a genuine information gap the market has left unfilled, rather than evidence that the pool is small. Even a conservative estimate of the trapped and addressable component of this capital, across the dozen or more institutions active on the continent, yields an opportunity measured in the billions of US dollars — sufficient to support a permanent capital platform of institutional scale with a genuine multi-year pipeline, without requiring heroic assumptions about any single institution's willingness to transact.

Table 5. Indicative characterisation of the opportunity.
DimensionIndicative characterisation
Asset universeMulti-billion-dollar pool of impaired, restructured and over-held development positions across the continent, concentrated on a small number of institutional balance sheets
Opportunity sizeSufficient to support a permanent capital platform of institutional scale with a multi-year pipeline
Value creation potentialDiscounted entry, restructuring uplift and long-term growth compounding within a perpetual structure
Return profileAttractive long-term, risk-adjusted returns from disciplined entry and active value creation, consistent with the global precedents in Part II
Impact profileCapital recycled for new development priorities; businesses and jobs preserved; SDG-aligned outcomes sustained and reported

The economic case rests on three sources of value, each addressed in detail in Part II: disciplined entry, acquiring impaired and illiquid positions at valuations that reflect realistic recovery rather than face value or fire-sale price; restructuring uplift, right-sizing capital structures and converting debt to equity to capture the recovery of viable businesses; and compounding, holding and reinvesting within a permanent structure so enterprise value can grow over years rather than being surrendered at a fund's maturity. The impact case is produced by the same discipline rather than competing with it: every transaction recycles development capital for redeployment, preserves productive businesses and the jobs they sustain, and carries forward measurable development outcomes. The financial and the developmental returns are not in tension. They are produced by the same disciplined ownership.

Notes — Part IV

  1. AfDB, press release, June 2024. ↩
  2. IFC, press release, June 2024. ↩
  3. BII, "Key Data." ↩
  4. Afreximbank FY2025 results, via AllAfrica, 2026. ↩

V.Parting Thoughts

What if we're right about the decade ahead — and what happens if nobody acts on it?

What if we're right?

A working-age population of 1.6 billion people does not arrive twice. Neither does a first-mover position on a specific, financeable market opportunity that presently belongs to no one. We have tried, across the preceding four parts, to make the case for both plainly and without exaggeration — using, wherever we could, numbers that others have published and that a diligence team can check for itself rather than take on our word.

Here is what we think happens if the decade ahead unfolds the way Part I's trendlines suggest it will, and nobody builds the vehicle this paper describes. Africa's population and workforce keep growing on schedule, because demography does not wait for financing architecture. The trapped value on development balance sheets keeps growing too, because the structural constraints described in Part II — thin secondary markets, scarce strategic buyers, shallow public listings — do not resolve themselves. Development institutions keep doing what they are mandated to do, which is originate new development lending, and keep accumulating the same residue of restructured debt and over-held equity they carry today, at a larger scale, because nobody has built the standing, repeatable mechanism to relieve them of it. The financing gap the AfDB has been citing for a decade remains roughly where it is, because aid is shrinking and foreign capital is volatile, and the private capital that could fill it stays exactly where Part II found it: already committed to the continent, and still not working.

And here is what we think happens if it does get built — not as a rhetorical flourish, but as the direct, mechanical consequence of the structure set out in Part IV. A development finance institution gets the exit channel it currently lacks: a professional, permanent, impact-aligned buyer for assets it can otherwise neither hold productively nor sell fairly. Capital that has been sitting immobilised gets recycled into the institution's next generation of development lending, multiplying its developmental reach rather than merely preserving it. A distressed or over-held company gets a committed long-term owner with the patience and operating capability to see a turnaround through, rather than a slow decline under an unsustainable capital structure or an owner counting down to a fund's maturity date. And an investor gets access to a return profile — disciplined entry, restructuring uplift, long-term compounding — that the precedents in Part II suggest can be genuinely attractive, in a market few institutional allocators are presently positioned to reach at all.

Why this, and why now

We are aware that a paper making a confident case for a specific investment thesis should be read with appropriate scepticism, and we would rather earn that scepticism's answer than avoid the question. So we will state plainly what would have to be true for this thesis to fail, because we think naming it is more persuasive than pretending it does not exist.

It fails if African development institutions decide the status quo — carrying trapped positions indefinitely — is preferable to a professionally governed, permanent alternative; we do not think this is likely, because the status quo has a real and rising cost in provisions, management attention and foregone redeployment, and because institutions like IFC have already validated the underlying model at global scale. It fails if the demographic and growth trends of Part I reverse; they have been running consistently for two decades and are underwritten by people already born, which makes a reversal a low-probability, not a zero-probability, risk — one this paper's diversification and governance discipline is built to absorb rather than ignore. And it fails if execution is poor — if valuation discipline slips, if concentration is not managed, if governance is treated as a formality rather than a genuine constraint on the manager. That risk is real in any investment vehicle, anywhere, and it is precisely why Part III spends as much time on governance and risk management as Part II spends on the return case. A thesis this specific succeeds or fails on execution, not on the argument in a concept paper — which is exactly why the next step, for any institution reading this, is a conversation about a specific portfolio, not a decision made from these pages alone.

It always seems impossible until it's done.Nelson Mandela

We offer this paper as the beginning of that conversation, not the end of one. Shiloh Capital intends to be the long-term steward of African development assets, and the preferred strategic partner for institutions seeking balance sheet optimisation, portfolio exits, restructuring solutions and durable development impact. We do not propose a conventional ten-year fund racing toward a forced exit. We propose a permanent capital platform built to hold, to compound, and to steward — for as long as Africa's decade ahead takes to unfold, which, on the numbers in Part I, is considerably longer than ten years.

The capital, as we said at the outset, is already there. The only remaining question is who is going to be positioned to act on it.

Appendix

Data tables, sourcing and methodology notes, a glossary, and important information.

A. Africa at a glance

Table A1. Key figures referenced in this paper.
MetricFigureSource
Population, 20241.5 billion (~10% of world population)UN DESA, World Population Prospects 2024
Population, 2050 (projected)~2.5 billion (~28% of world population)UN DESA / UNECA, 2024
Working-age population, 2024 → 2050883 million → ~1.6 billionUNECA, citing UN DESA WPP 2024
Real GDP growth, 2025 / 2026 / 20274.4% / 4.2% / 4.4% (continental average)AfDB, African Economic Outlook 2026
Mobile money transaction value, SSA, 2025$1.4 trillion (66% of global total)GSMA, State of the Industry Report on Mobile Money 2026
AfCFTA signatories' combined GDP~$3.4 trillion, 1.3 billion peopleU.S. Dept. of Commerce / Trade.gov, Dec. 2025
Infrastructure financing gap$50–90 billion/year (need: $130–170bn; invested: ~$80bn)AUDA-NEPAD / AfDB, 2025
Remittances to Africa, 2023$90.8 billion (11% of global total)Mo Ibrahim Foundation, "Facts & Figures," May 2025
Official development assistance to Africa, 2023$73.6 billion (26.7% of global ODA, down from 37.6% in 2013)Mo Ibrahim Foundation, ibid.
FDI inflows to Africa, H1 2025$28 billion (–42% year-on-year)UNCTAD, Global Investment Trends Monitor, Oct. 2025

B. Development finance institutions active on the continent

Table A2. Selected DFI/MDB scale figures. Figures are shown on the basis disclosed by each institution and are not mutually comparable (see note below).
InstitutionFigureBasis
African Development Bank Group$318 billion total authorised capitalCapital base, post June 2024 increase
IFC (World Bank Group)$14.2 billion Africa commitments, FY2024Annual commitment (own account + mobilised)
British International Investment$5.5 billion Africa portfolio (60% of total)Committed portfolio, end-2025
Afreximbank$48.5 billion total assets & contingenciesBalance sheet, FY2025
Proparco (France)~€1.3 billion Africa signings, 2024 (47% of total)Annual new business
DEG (Germany)€609 million Africa/MENA new business, 2024Annual new business
U.S. International Development Finance Corporation>$12 billion committed globally, FY2024; Africa share not separately disclosedAnnual global commitment
World Bank / IDA21$100 billion record replenishment, Dec. 2024; two-thirds to low-income African countriesMulti-year replenishment

Note on Table A2: these figures mix total capital base, cumulative balance-sheet assets, and single-year commitment or new-business volumes, and reflect each institution's own disclosure practice — none publishes a standardised "African trapped or restructured asset" line, which is itself a data point about how opaque this market currently is. We show the figures to establish order of magnitude, not to be summed into a single addressable-market number.

C. Return precedents cited in this paper

Table A3. Permanent capital vehicles and their disclosed long-run compound annual returns.
VehicleMetricPeriodSource
Berkshire Hathaway19.9% (per-share market value) vs. 10.4% (S&P 500 w/ dividends)1965–2024Berkshire Hathaway, 2024 Annual Report
Investor AB17% (total shareholder return) vs. 11% (SIXRX index)2004–2024 & 2014–2024Investor AB, 2024 Annual Report
Exor18.0% (NAV/share) vs. 12.0% (MSCI World)2009–2024Exor, 2024 Annual Report
Fairfax Financial18.7% (book value/share, incl. dividends)1985–2024Fairfax Financial, 2024 Shareholders' Letter
Table A4. Distressed-to-equity investing — aggregate benchmark data.
MeasureFigureSource
Pooled median net IRR, distressed PE, 1999–2008 vintages14.4% (std. dev. 17.5 pts)Preqin, Special Report: Distressed Private Equity
Best vintage (2002) median net IRR26.4%Preqin, ibid.
Weakest vintage median net IRR~8.0%Preqin, ibid.
African PE/VC pooled 10-year net return (as of ~2012)11.2%Cambridge Associates / AVCA Index, April 2013
Same index, pooled 10-year net return (as of ~2016)5.47%Cambridge Associates / AVCA Index, April 2017

D. Methodology and sourcing notes

We have tried, throughout this paper, to cite a specific, checkable source for every figure, and to say plainly where public data is thin, contested or unavailable rather than fill the gap with false precision. A reader who intends to rely on this paper in an investment-committee context should be aware of the following specific points, each of which we flag here in the interest of transparency:

Africa's nominal GDP. Sources diverge materially — the Mo Ibrahim Foundation cites $2.78 trillion for 2024, while IMF World Economic Outlook figures compiled by third parties suggest a higher $3.1–3.6 trillion range for 2024–25. We have not attempted to reconcile these in this paper and would recommend pulling the primary IMF WEO database directly for any calculation that depends on a single figure.

Urbanisation. The OECD's 2025 estimate (roughly 700 million urban Africans today, doubling to 1.4 billion by 2050) and UN-Habitat's longer-range estimate (roughly two-thirds urbanised by 2050) imply somewhat different trajectories. We have presented both rather than picking one.

DFI legacy-asset disclosure. No development finance institution reviewed in preparing this paper publicly discloses the share of its portfolio that is non-performing, restructured or held past its intended exit horizon. This is a genuine gap in market transparency, not a number we have chosen to omit — and it is itself part of the case for the platform this paper proposes, which would report on exactly this basis.

African manager-level returns. Fund-level IRR and multiple data for named African private equity and credit managers is not, to our knowledge, publicly disclosed by any manager active on the continent. The aggregate Cambridge Associates / AVCA benchmark cited in Table A4 is the most recent comparable series we were able to locate, and it is more than a decade old at its most recent data point.

E. Glossary

DFIDevelopment finance institution — a bilateral or national institution that provides capital, typically debt and equity, to private-sector projects in developing markets on terms commercial capital will not offer.
MDBMultilateral development bank — a development finance institution owned by multiple sovereign governments, such as the African Development Bank or the World Bank Group.
NPLNon-performing loan — debt on which contractual payments have lapsed or are materially impaired.
Blended financeThe strategic use of concessional development capital to mobilise additional private-sector investment into a transaction or fund.
Permanent capital vehicleAn investment vehicle with no fixed life, able to hold assets indefinitely and reinvest realised proceeds rather than distribute them on a fixed schedule.
IRRInternal rate of return — the annualised return of an investment accounting for the timing and size of all cash flows.
Continuation vehicleA new fund vehicle created by a private equity manager to hold one or more assets beyond the life of the original fund, typically offering existing investors the choice of cash liquidity or rolling into the new vehicle.
AfCFTAAfrican Continental Free Trade Area — a fifty-four-member trade agreement aiming to create a single African market.

Notes & sources — full index

Every citation in this paper is numbered within the Part in which it appears, and linked in place. Jump to Part I, Part II, Part III, or Part IV for the full source list.

Important information. This document has been prepared by Shiloh Capital and is provided solely for information and discussion purposes. It is strictly confidential and intended only for the institutional recipient to whom it is delivered. It may not be reproduced or redistributed, in whole or in part, without the prior written consent of Shiloh Capital.

Nothing in this document constitutes investment, legal, tax or accounting advice, an offer or solicitation to buy or sell any security or investment product, or a recommendation in respect of any investment programme or service. Any such offer would be made only pursuant to definitive documentation, the terms of which would govern in their entirety.

The concept described in this document is preliminary and indicative. Figures, structures and scenarios are illustrative, are subject to change, and require detailed institution-specific analysis and confirmation. Statements regarding the size of the opportunity, value creation and returns are estimates and forecasts only; forecasts are not a reliable indicator of future performance, and past performance is not a guarantee of future results. Figures concerning third-party institutions, markets and precedent transactions are drawn from public sources cited throughout this document and have not been independently verified by Shiloh Capital.

Shiloh Capital is a juristic representative of FyreFem Fund Managers (FSP No. 49359). Regulatory status in respect of any specific vehicle would be confirmed as part of fund formation. While the information herein has been prepared in good faith, no representation or warranty, express or implied, is made as to its accuracy, completeness or reliability, and Shiloh Capital accepts no liability for any loss arising from reliance on it.

© Shiloh Capital 2026. All rights reserved.
Office 212, Max Office Park, 145 Second Street, Parkmore, Sandton, Johannesburg